
Shifting from reactive support for remote user issues to proactive IT support
The best way to explain this is with a specific scenario:
A remote user logs a ticket related to an IT issue, which could be a lack of functionality, system slowness or any other issue impacting user productivity. Traditionally, this required an L1 help desk analyst to call the user, understand the issue, share logs and perform root cause analysis. After this point, the ticket would then get escalated to an L2 analyst, who would have to call the user again to apply remediations by taking control of the system.
Using this approach, the service desk team will often disrupt the user many times, either by visiting them at their desk in a traditional office setting or using remote control tools when users are working from home. Both approaches result in a loss of user productivity and business disruption.
Neither approach is suitable for the modern Work From Anywhere Enterprise, so what if you could ‘surgically’ correct the problem without ever having to disrupt the user or the business and thus shift to proactive IT support?
That’s exactly what the 1E Tachyon Platform help our customers do every day. Let me show you how in three steps:
- Identify
- Correlate
- Remediate
1. Identify using the 1E Tachyon Experience console
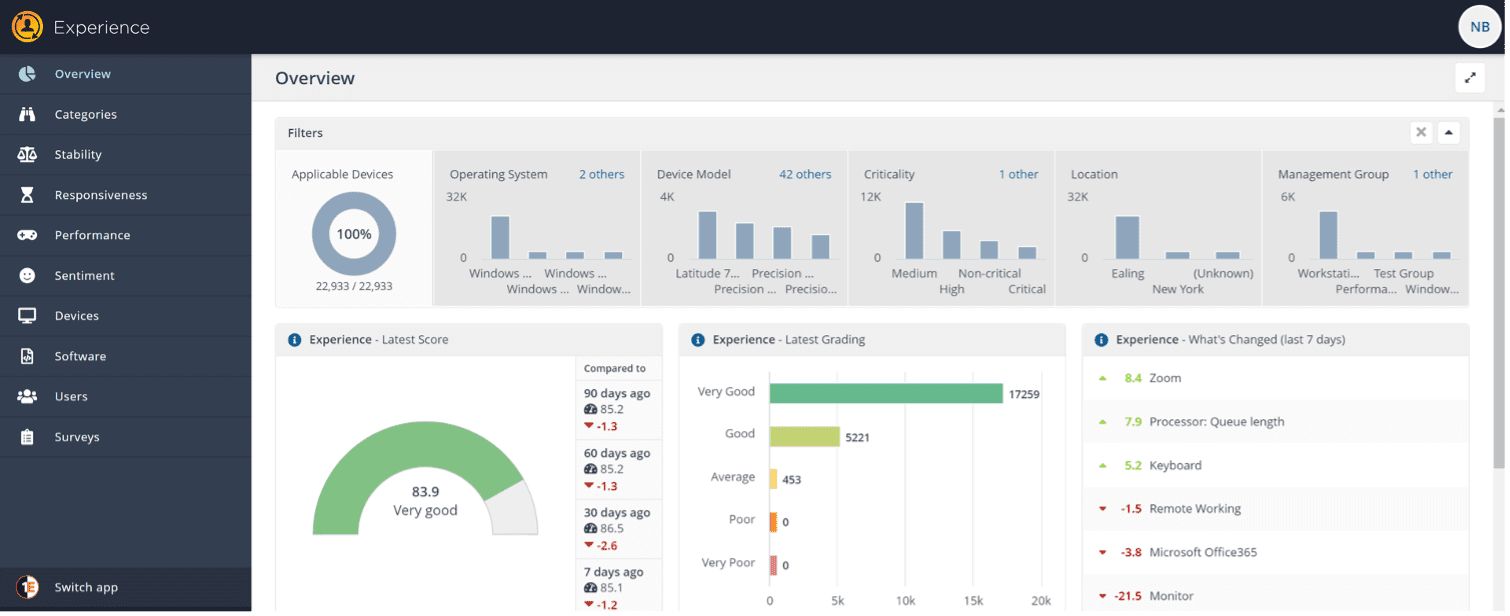
Tachyon Experience provides a wealth of thorough information on metrics one would ever need to troubleshoot their IT environment. Below is a screenshot of the Overview page that shows an admin what’s going on in their environment and where to focus their attention.
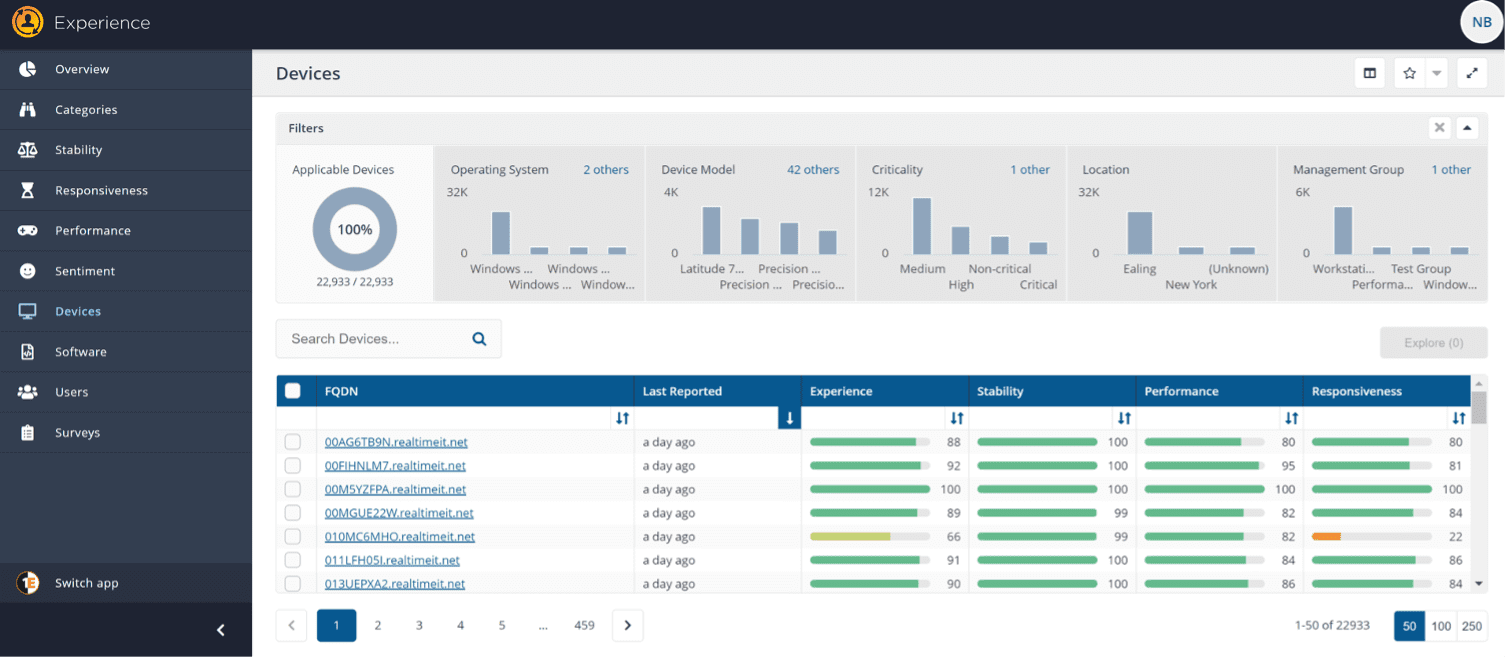
Given our persona is L1/L2, let’s navigate to the Devices page which shows device-specific information …
… and filter for the specific device to navigate and look at a specific device we are going to investigate.
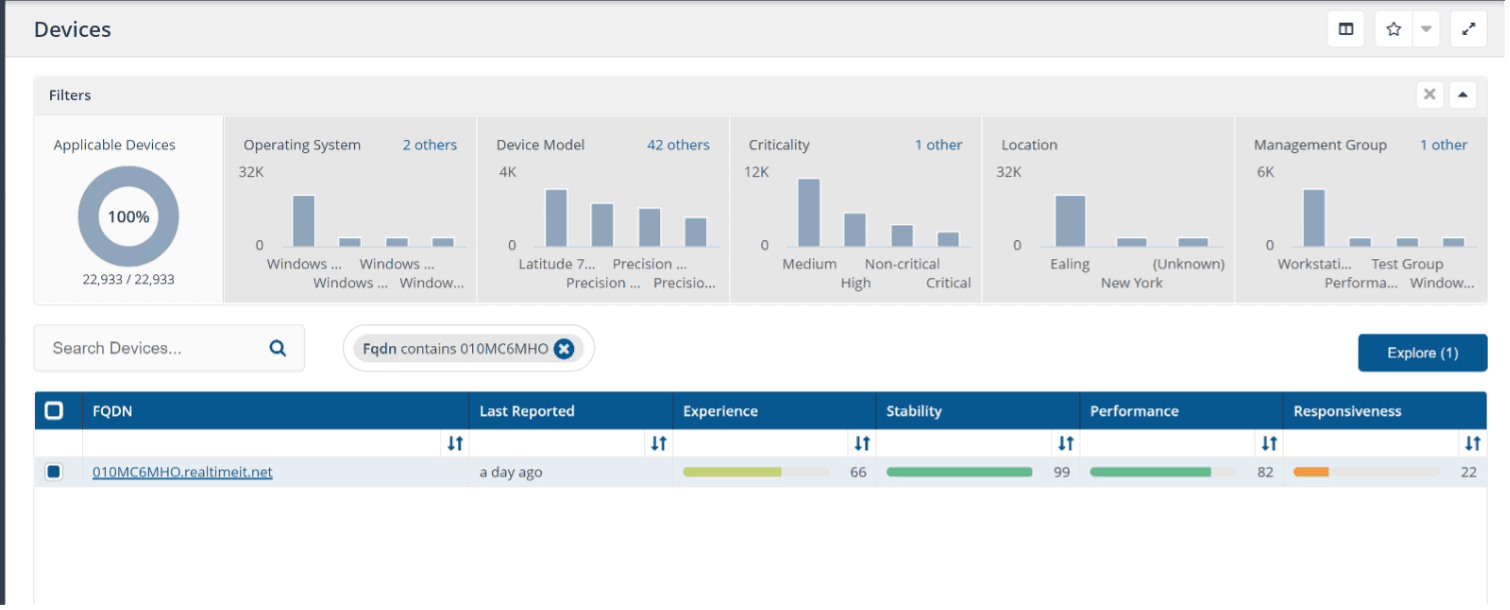
Here we have live information about the device’s stability, performance, and responsiveness. Each one of these are combined with the user’s sentiment to provide a high-level Experience Score. We are quickly able to see that Responsiveness is the most impactful parameter on this device.
2. Correlate using 1E Tachyon Experience metrics
Let’s dig in deeper by clicking on ‘Responsiveness’. This will show LIVE information from the device on each and every metric calculated so that an L1/L2 analyst can focus their troubleshooting efforts to the exact factors that are causing a poor score in this category.
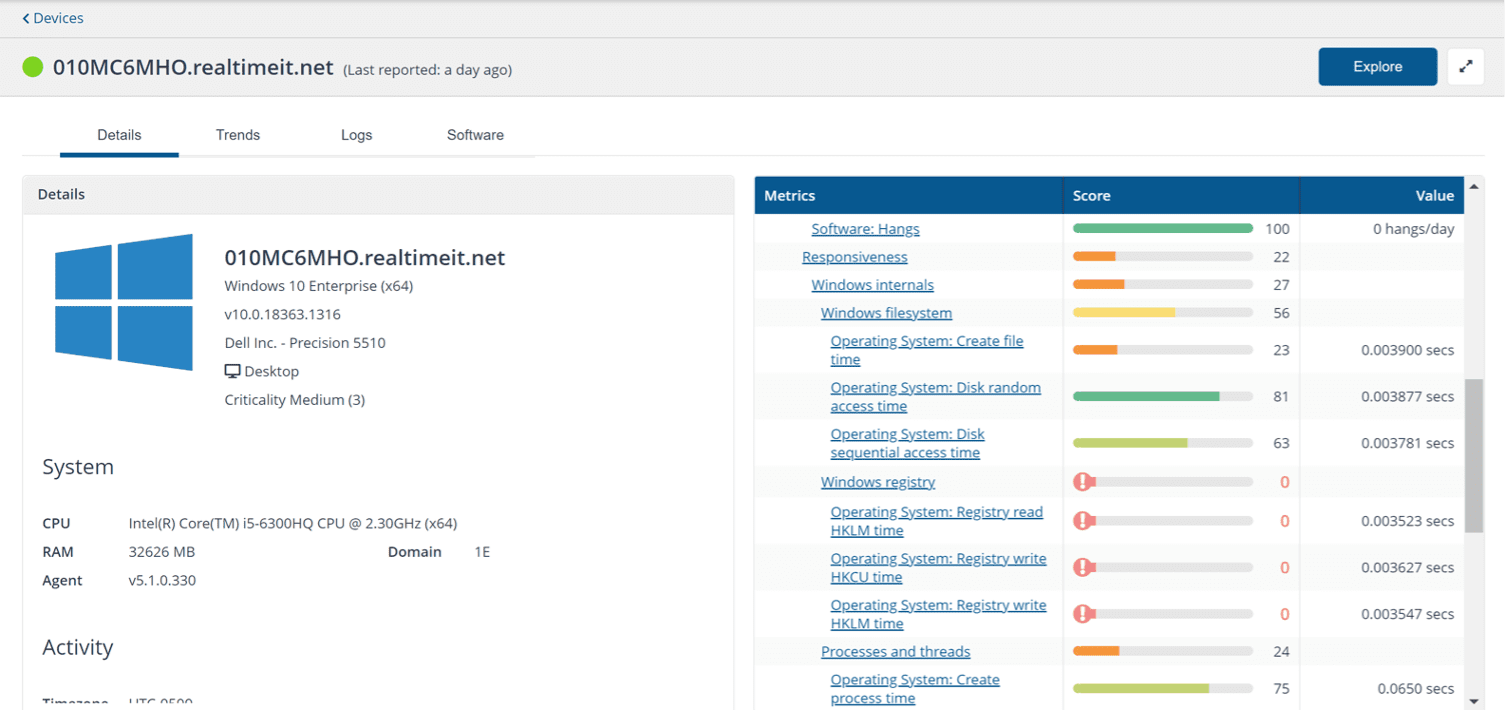
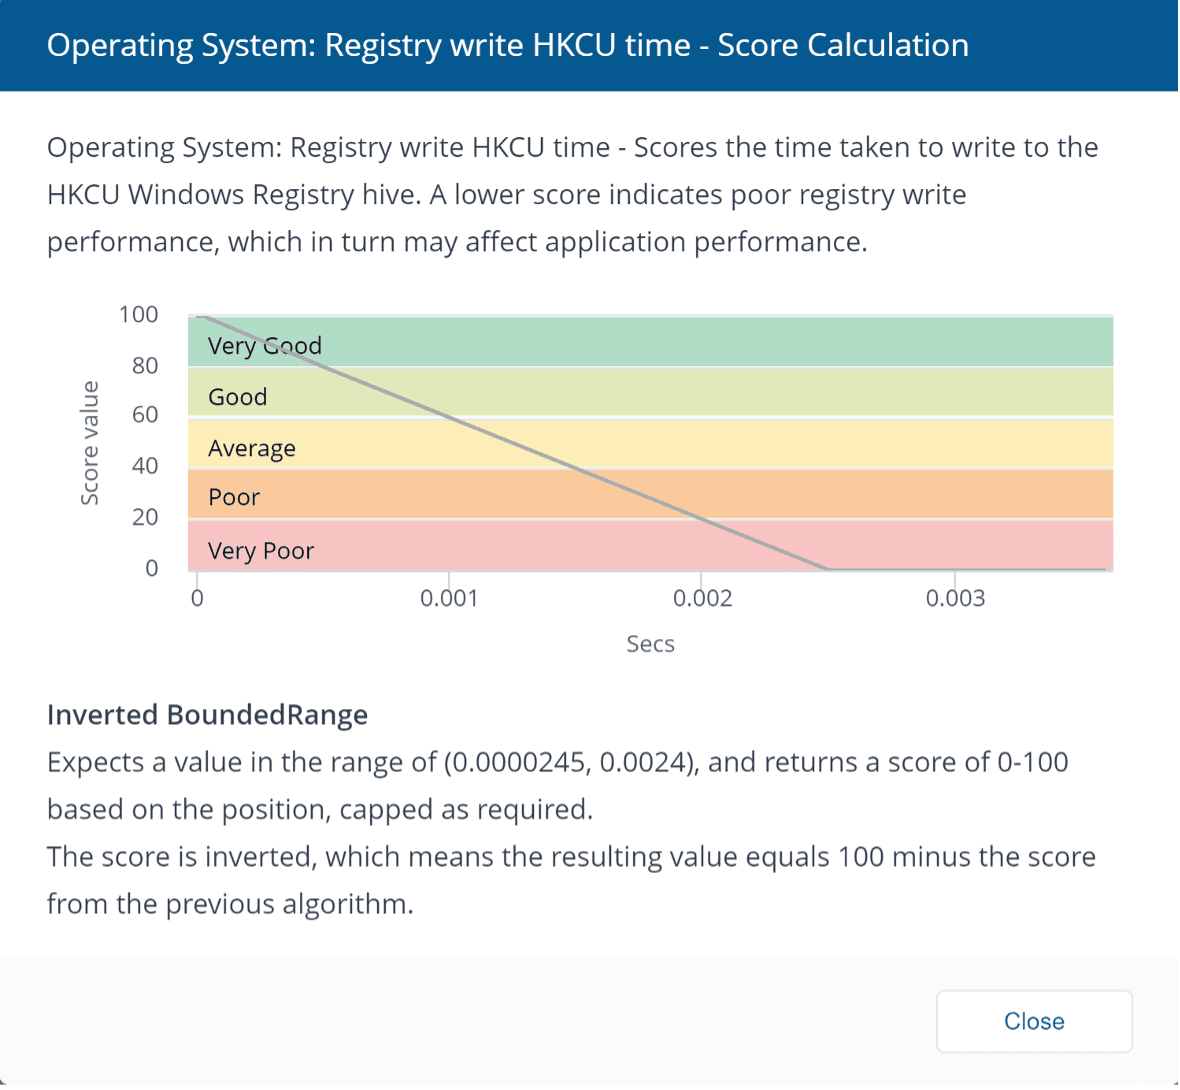
We can now see that clearly the system is struggling with read/writes to the registry and disk-related issues. This is one of the synthetic transactions that 1E Tachyon runs to generate the metric for your end-user device. Clicking on the metric shows how it is calculating the score.
The 1E Tachyon Platform also correlates this information by looking at trends, logs and software stability information from this device, which is available via different tabs.
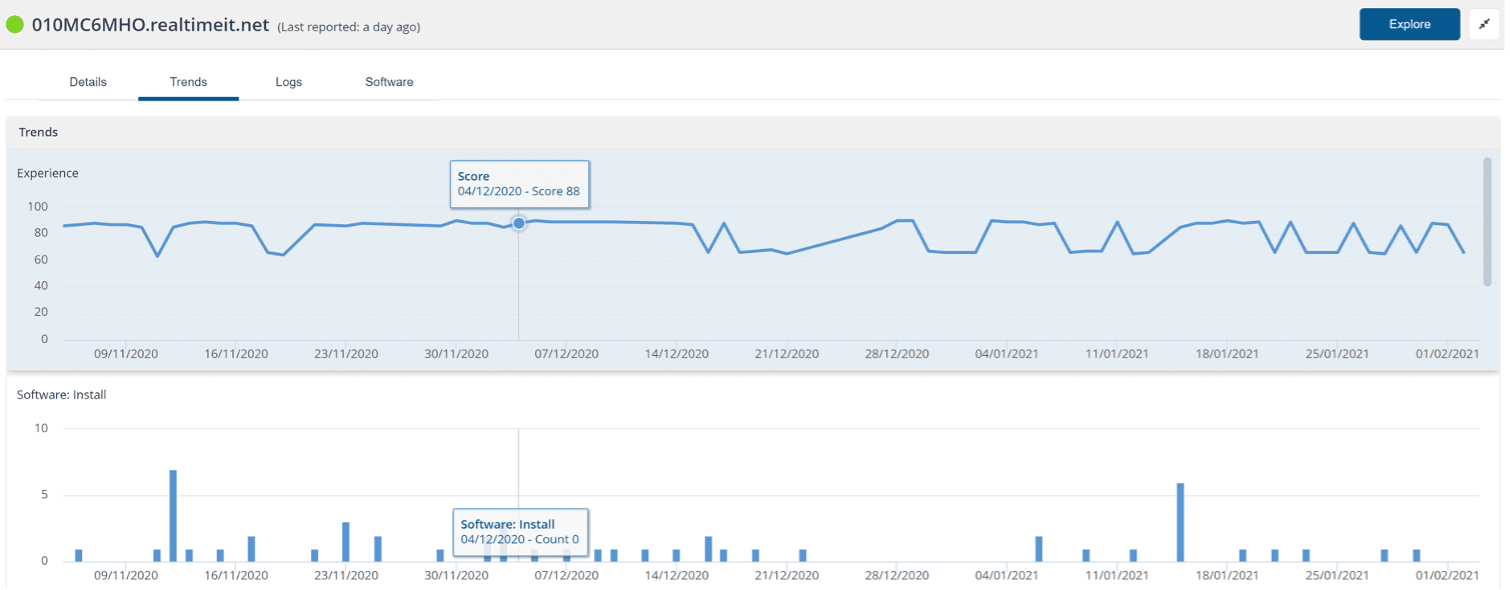
Clicking on Trends show all events in the device’s timeline that occurred and are impacting the end-user experience (positive or negative). You can customize this view and to see any software, hotfix, driver update, Windows OS upgrade or a patch install, to understand what happened prior and after such an event.
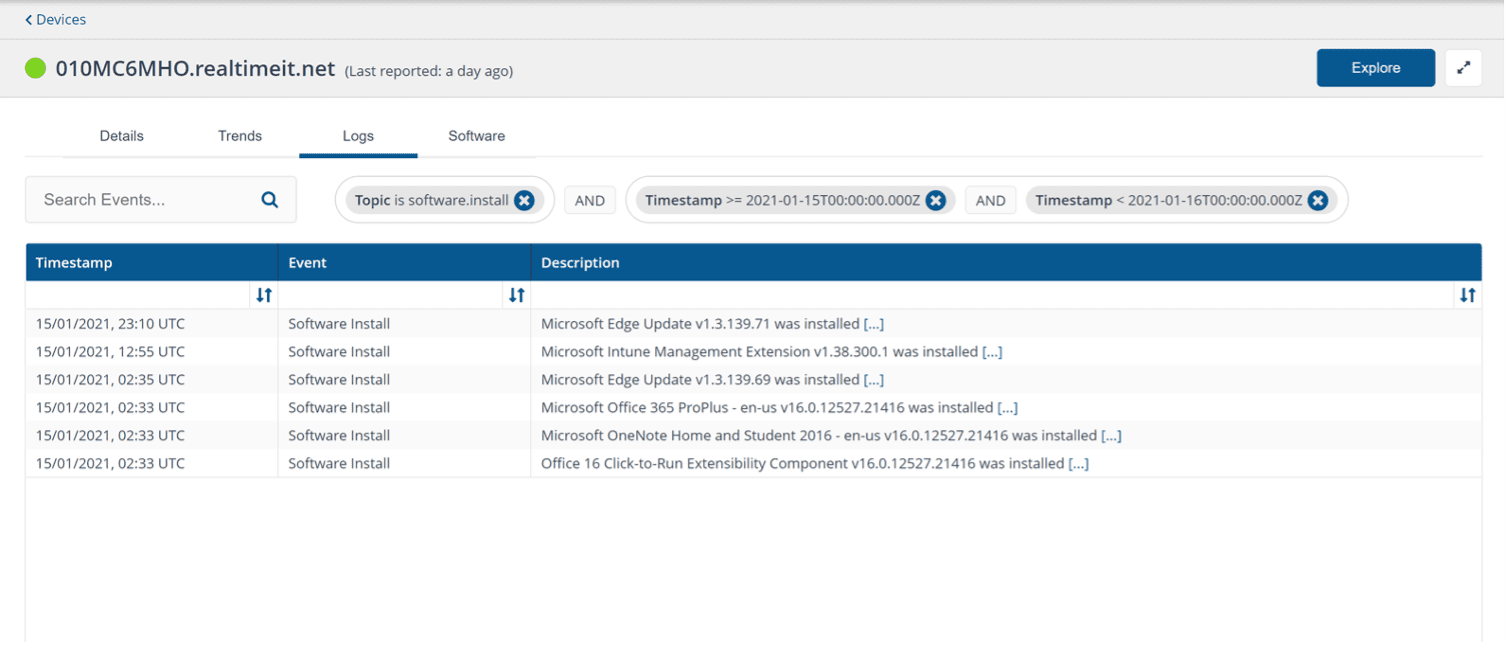
Clicking on any of these timeline events shall take you to the Logs screen that provides specific details of what happened (in the specified timeline):
Another useful set of correlated data is to look for software culprits that could be impacting the ‘category’ of issues an L1/L2 analyst is troubleshooting. Here, we look at ‘Responsiveness’ in the Software Tab to understand which software could be causing the most issues and degrading the end-user experience.
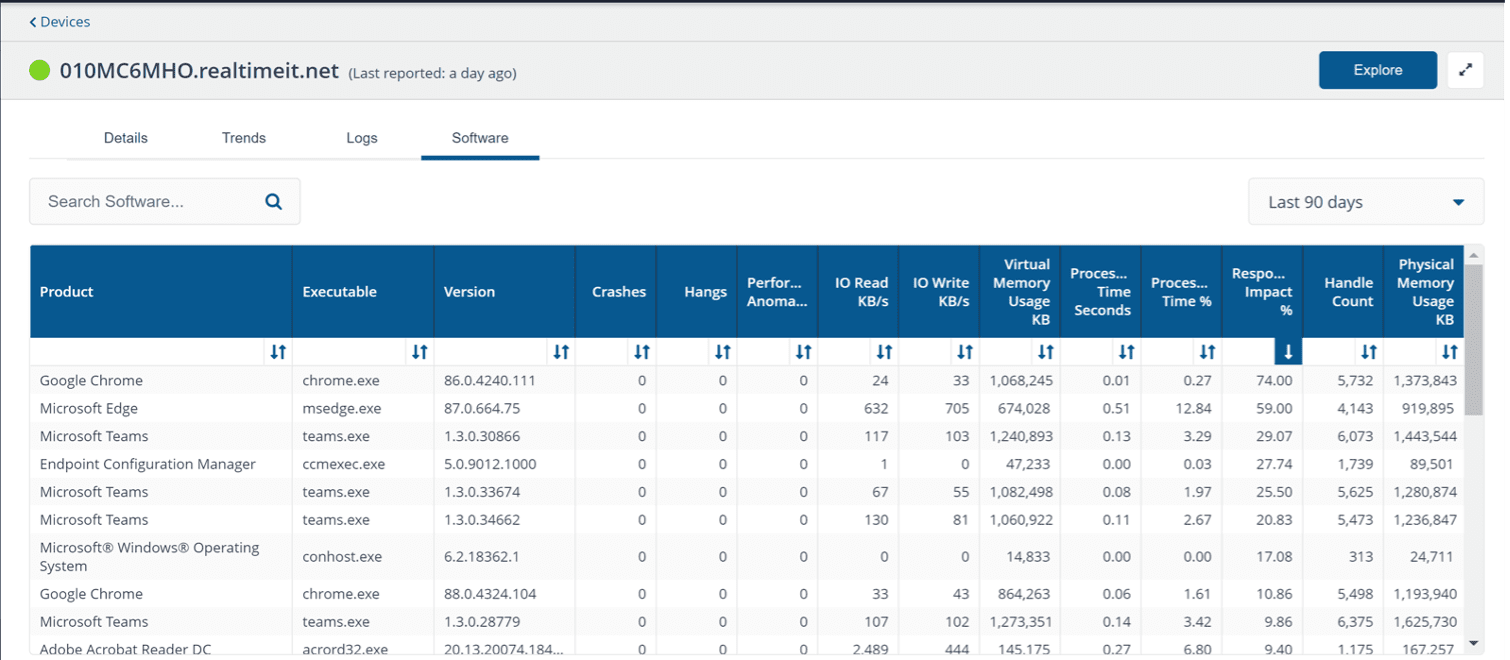
Now, we have data on what the factors are, and which applications or processes are likely culprits contributing to performance degradation. In this case, it’s a combination of high registry read/writes combined with certain applications that are causing such registry peaks and disk I/O. This data is incredibly valuable for any hardware or software vendor to justify developing a fix.
3. Remediate using a 1E Tachyon Platform action
From the same window where troubleshooting data has been identified, the analyst can click on Explore. This will allow them to perform real-time queries and real-time remediation that the L1/L2 analysts have permissions to execute, allowing them to further diagnose the issue and/or collect any further information required before making a change to resolve the issue.
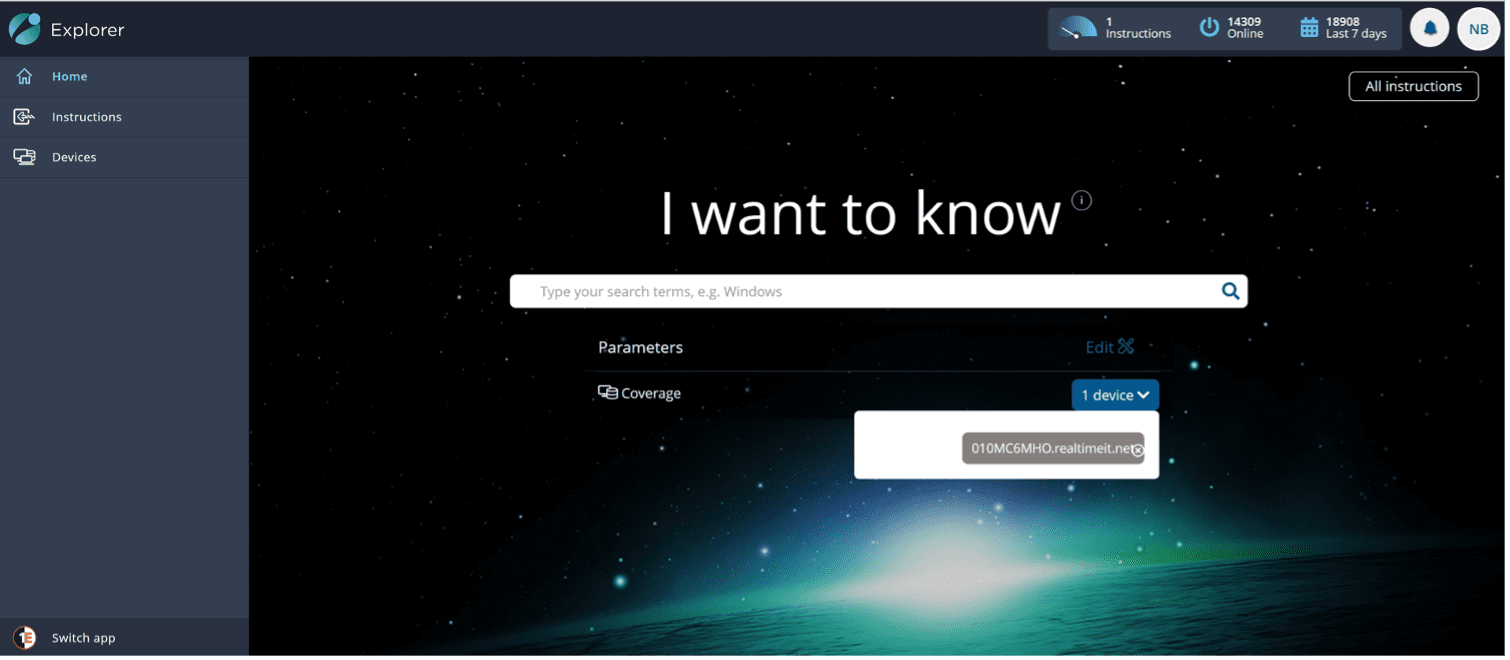
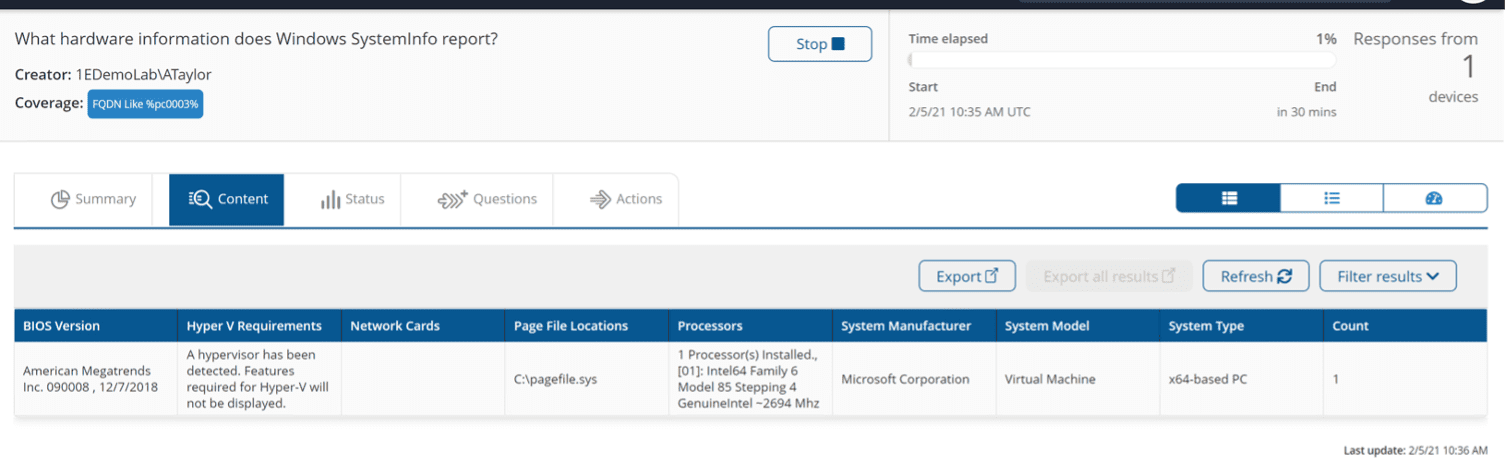
As you can see, the device is pre-filtered already so you can focus your troubleshooting effort to that specific device in your environment. The analyst can run any queries and get instant data from the device, such as which user is currently logged on, or which processes are currently active and their live resource consumption. This is to provide any other troubleshooting parameter to further diagnose the issue at hand or directly perform an action that will cause a change on the endpoint (with appropriate workflow approvals). In this case, I ran a further query to understand the paging file locations and hardware vendor information.
From the same window, the analyst can run actions to remediate the issue, whether it’s applying a hotfix, a software update, killing a process or even performing registry / disk diagnostics. Note that all of this happens without disrupting the user as they are working. User notifications (with a relevant message) can be sent to inform the user that the system is being healed in the background.
Here is a list of actions available to the analyst as a step 1 to diagnose the issue:
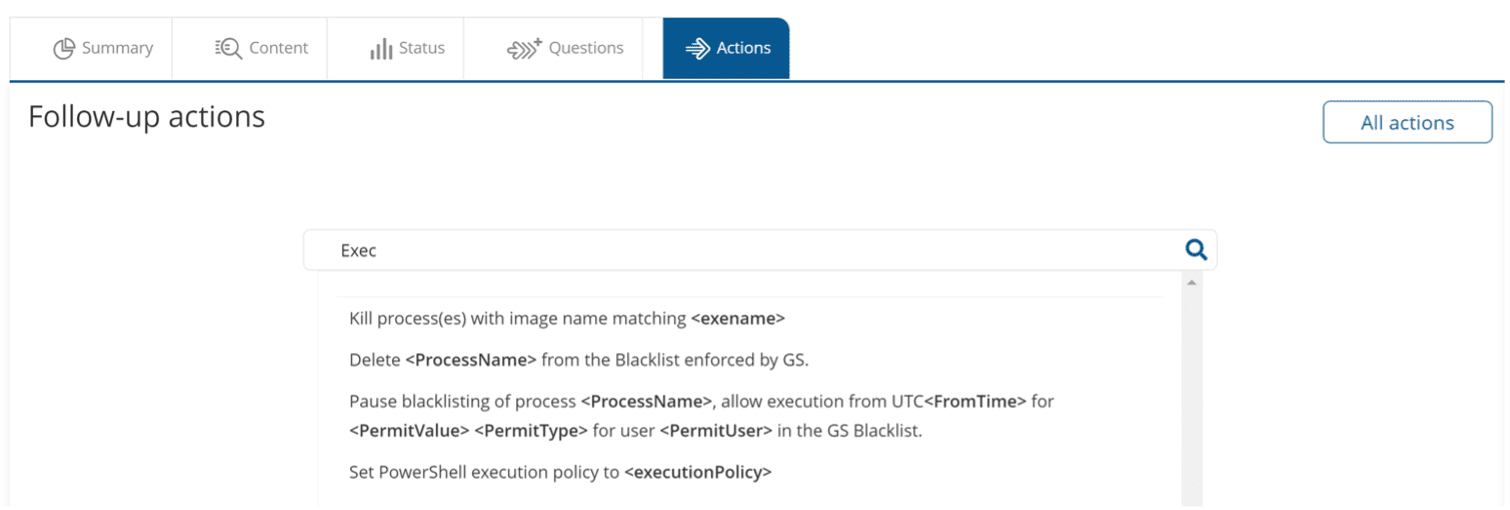
The analyst is able to see the action and its corresponding impact immediately. Typing in natural language also displays all matching actions available to the analyst.
This is how an analyst is able to identify, correlate and remediate an issue within the same platform to achieve faster troubleshooting of IT issues in their environment.
Integrations
If you have an ITSM ticketing system in place, the 1E Platform integrations allow the ticket window itself to show all the device/user parameters, trends and live information required to troubleshoot the issue. This also includes correlated events and timelines to provide an educated answer to the L1/L2 help desk within the ITSM Ticket window specific to the device/user. This brings the entire power of the 1E Platforms inside a Ticket. Now, that’s powerful!
Supported Integrations: ServiceNow, Microsoft SCCM, Cherwell, BMC Remedy* and any ticketing system that supports REST API.
* Coming soon – 2021 roadmap item
In my next blog, I’ll cover how an L3 admin can use the same toolset and troubleshoot issues that are impacting a wide audience.
To see the 1E Tachyon Platform in action, you can book a demo here. To learn more about how our solutions solve real business challenges, take a look at the Tachyon Masterclass.

?")
