Data center performance metrics have struggled to accurately represent business value of IT assets invested in the enterprise data center. Data center metrics are either constrained to raw power usage data, or make vague approximations about business-relevant performance through assumptive percentages or abstract proxies.
At Data Center Dynamics in Washington, DC this week, 1E introduced an improved method of data center performance measurement and governance based on empirically derived measures of data processing “usefulness.”
Toward Business Relevance in Data Center Metrics
The legacy of data center metric activity over the past decade has been largely focused on energy efficiency. This is good because of the enormous quantities of energy consumed by contemporary data centers, and the significant resulting amounts of carbon emissions. The work done by the Green Grid and others toward the definition of PUE (Power Usage Effectiveness) enjoys the bulk of mindshare in this regard. However, metrics such as PUE and DCiE are essentially limited to the end of the power cord to the IT kit. Furthermore, these metrics give no insight into the value to the business of the data processing happening at the end of that power cord, nor to the costs implied by what that cord is powering.
There have been attempts at including business relevance into data center metrics, and to make these metrics less exclusive to the facility side of the equation.

The Corporate Average Datacenter Efficiency (CADE) metric, developed by The Uptime Institute and the 451 Group is one such example. Within CADE there is the notion of “facilities” (the plant) and “assets” (IT), and also of efficiency modulated by utilization. Many have tossed darts at CADE for being difficult to understand, difficult to compute, and producing counter intuitive results. CADE though was one of the first metrics to hold a place for “useful work.” The ability to measure useful work was left by the way by CADE, ultimately suggesting a percentage value be used in its place.
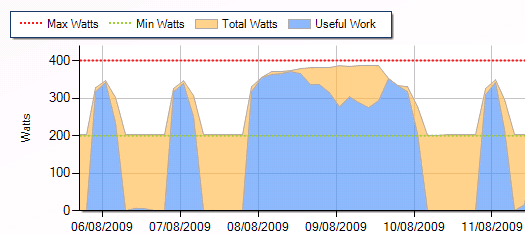
The Fixed to Variable Energy Ratio (FVER) was more recently released into the wild by authors at the British Computing Society (BCS). FVER does several novel things, most notably recognizing that some data center energy consumption is fixed and does not change, while another bit of energy consumption is variable and driven by the data processing taking place in the data center (this is the “useful” part). FVER goes on to suggest that we select a “proxy” for the data processing activity and use that to represent value of this investment to the business. A proxy can be something like file transfers, songs streamed, transactions, and so on.
Still, whether with CADE or with FVER, inclusion of how our data center is delivering real business value by existing performance metrics is left to intuitive estimation or interpretation by abstraction.
Lights are on, but is anyone home?
Traditionally, server activity is measured using basic utilization values gleaned from network and systems management tools. We gather CPU utilization, NIC activity, and so on. We see “vital signs” of the server, but it is essentially a black box to us. That is, if we see 30% server utilization for example, we are left with our own best guess whether that activity is purposeful or not. Because we lack the clarity of information about this utilization, we most often make the decision to maintain this server for fear we will interrupt a business process if we take steps to decommission it.
We call this the “Lights are on but nobody’s home” approach. That 30% utilization may be a stuck process. It may be due to backup or administrative routines. It may be a screen saver. It could be lots of things, but whether all or some of this 30% activity is purposeful to the business or not can only be determined by inference and assumption.
A better approach
 What if we actually measured data processing activity inside the server? What if we had the ability to see each and every process running on the server and categorize it as useful or non-useful; critical or non-critical? What if we were able to collect this information and correlate it, graph it, trend it, for every server in the estate whether physical or virtual? This is, in fact, what the Useful Work Assessment offered by 1E does.
Abundance of value outcomes
The Useful Work Assessment can deliver a wide range of beneficial results to the enterprise or data center operator. At its most basic level, it identifies physical and virtual server waste with effectiveness not possible with any other method. It can identify licenses used versus licensed owned, for software cost savings. It can reveal a view of data processing activity that is beneficial in reducing risk for data center consolidations, migrations, DR Planning, and migrations to the cloud.
In the conference presentation, the value outcomes of packaged service offering from 1E were described, and how it benefits the enterprise and managed hosting provider. Details can be found at 1E’s web site.


