
John DeVito here again with another blog on Linux. In this blog we'll look at another aspect of what the 1E Platform can do to help with some of the tasks you may want to perform on Linux systems. This blog relates to insight into the memory on your devices.
As with all of the instructions we have for Linux, the operating system is detected. The instructions covered here will gracefully exit with a NOTIMPLEMENTED status if executed against a Windows or Macintosh system. They've been tested on several different distros, and several different versions of those distros. As a reference, this is the information about the devices you'll see in the blog.
| Partial Name | Distro |
| LABDBX64 | Debian |
| LABUX64 | Ubuntu |
| LABFX64 | Fedora |
| LABC#X64 | CentOS |
| LABRX64 | RedHat |
| LABSX64 | openSUSE |
In addition to these distros, it's expected that these instructions should run on any distro that supports the sysstat package.
Basic memory information
The "Get Linux memory statistics" question gets information about the memory configuration of a system, including the total, used free, shared, cache, and available memory for both the physical memory and the swap file. The Get Linux memory statistics question gets information about the memory configuration of a system, including the total, used free, shared, cache, and available memory for both the physical memory and the swap file.
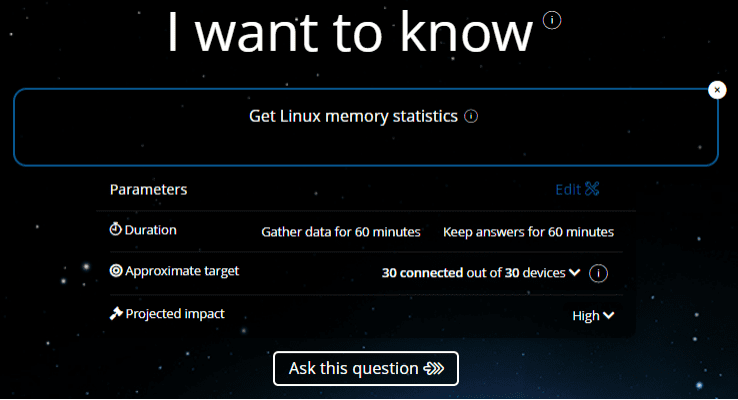
The output of the instruction appears as shown below:
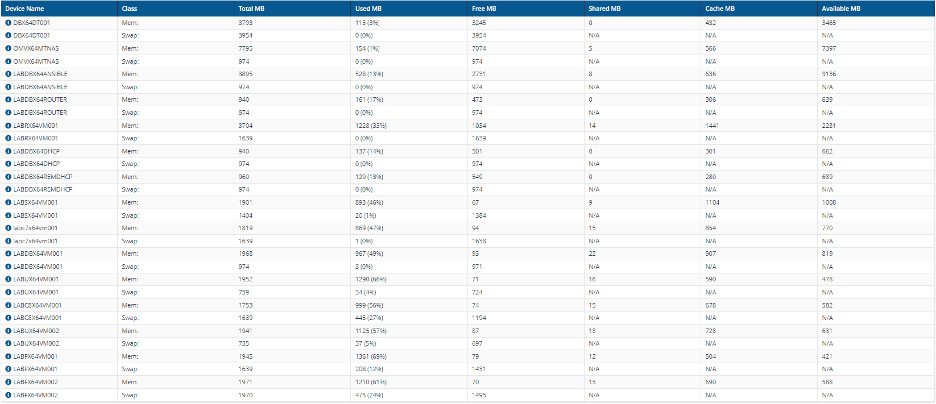
Each device has two lines in the output, one for the physical memory (Class: Mem) and one for the swap file (Class: Swap).
The information is fairly basic, and it gives some insight into the memory configuration and usage on your systems, but that doesn't tell the whole story. If you're like me, you want to know how that memory is actually performing. Knowing how much memory is used, and how much of the swap file is in use is interesting, but what is the actual health of the memory in our devices?
Get Linux paging analysis
We can use the "Get Linux paging analysis" instruction to identify the status of the memory health for our devices. Back in the day we used to talk about "memory thrashing". These days they call it "memory pressure".
This instruction collects information about memory health, like swap file activity, Hard (major) and Soft (minor) page faults, and waiting processes. An efficiency score is generated, and any memory efficiency that's greater than 0 and less than 30 shows a warning in the output, indicating that the memory subsystem is stressed.
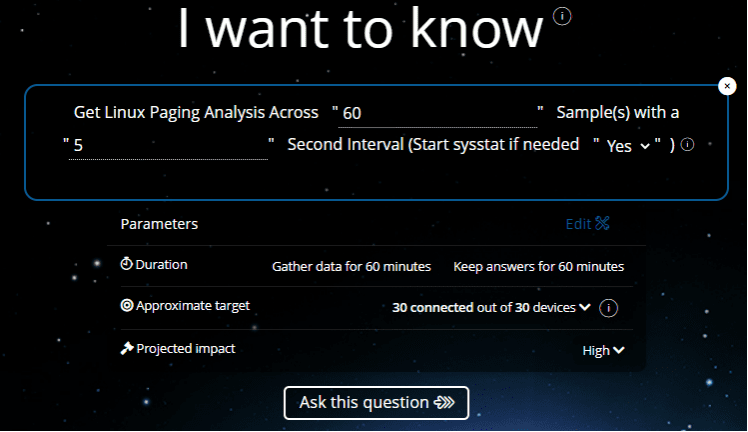
You'll note that there are a few parameters available to configure when you run the instruction.
The first I'll address is the "Start sysstat if needed" parameter. It is a dropdown box, allowing you to select yes or no. The sysstat package is used to collect the data for memory analysis. If the package isn't installed on a device, the Efficiency column will contain a message that the package is not installed, and all of the other columns will display "N/A".
You can use the "Install Linux Package" instruction in the Linux Software Management product pack to install it if you wish. If the package is installed and the sysstat daemon is running, the data is collected. If the sysstat package is installed and the sysstat daemon isn't running—and you've selected "No" for this parameter—a message will appear in the Efficiency column indicating the daemon isn't running. All of the other columns will display "N/A". If the package is installed and the sysstat daemon isn't running—and you've selected "Yes" for this parameter—the sysstat daemon will be started, the data collected, and then the sysstat daemon is stopped, returning it to it's previous state.
The other parameters allow you to define the number of samples to take and the interval between samples (and, by extension, the duration of sampling). In the screenshot above you see that we are taking 60 samples at 5 second intervals. That means the duration of the sampling is 5 minutes. We could also configure a five minute duration by specifying 30 samples with a 10 second interval. Or 20 samples with a 15 second interval. They amount to the same sample duration for all three examples, but the granularity is different. The first (in the screenshot) is more granular than the second. The third example is the least granular of all. It is through these parameters that you can control the load that you are putting on the systems as you collect your samples.
The collected data looks like this:
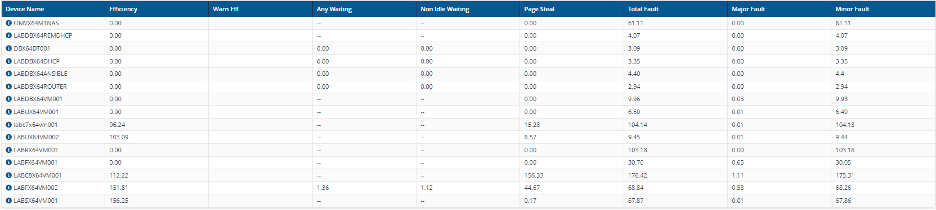
This is data from my lab, so it isn't terribly exciting. But I do have multiple applications open on some of the devices, so you can see that some of the measurements are higher on those devices than on others. There are two things to point out.
The WarnEff column is blank. The idea is that, if you see "WARN" in one of the cells, then the associated device is having some "memory pressure" issues and needs to be further examined. The other columns are there to help you "dig into" the data a little further.
You'll also notice that the "waiting" columns may or may not have numbers in them. Some have dashes (–) in them. This has to do with the version of the sysstat package installed on the devices. If the device is running a version of sysstat that's 12.5 or greater, the "Waiting" statistics are collected by the sysstat daemon. If the device is running a version of sysstat that's lower than 12.5, the sysstat daemon doesn't collect the "Waiting" statistics, so the dashes appear in those columns.
Thanks for spending your time reading this blog, and we hope that these instructions provide you with some helpful functionality as you use the 1E Platform to manage the Linux devices in your environment.
If you're interested in learning more about Linux repositories and updates, you can check out part one, part two, and part three of this series!


?")
