
Shifting from Reactive to Proactive IT Support for Remote User Issues
In our previous blog, we learnt how an L1/L2 Analyst can utilize the 1E Platform to identify, correlate, and remediate IT issues that are specific to a single user or device. In this post, we’ll consider how an L3 Admin, who has a wider scope of the IT environment, can utilize the same toolset to troubleshoot issues that are impacting a large audience.
1. Where, What, When?
Let’s start at the Experience Overview dashboard which provides a single source of information to all levels of ServiceDesk analysts. Below is a screenshot of the Experience Overview page that shows an admin what’s going on in their environment and where to focus their attention. As an L3 Admin, it’s important to know where you stand in your IT environment on any given day and should always have a full view of how it’s performing.
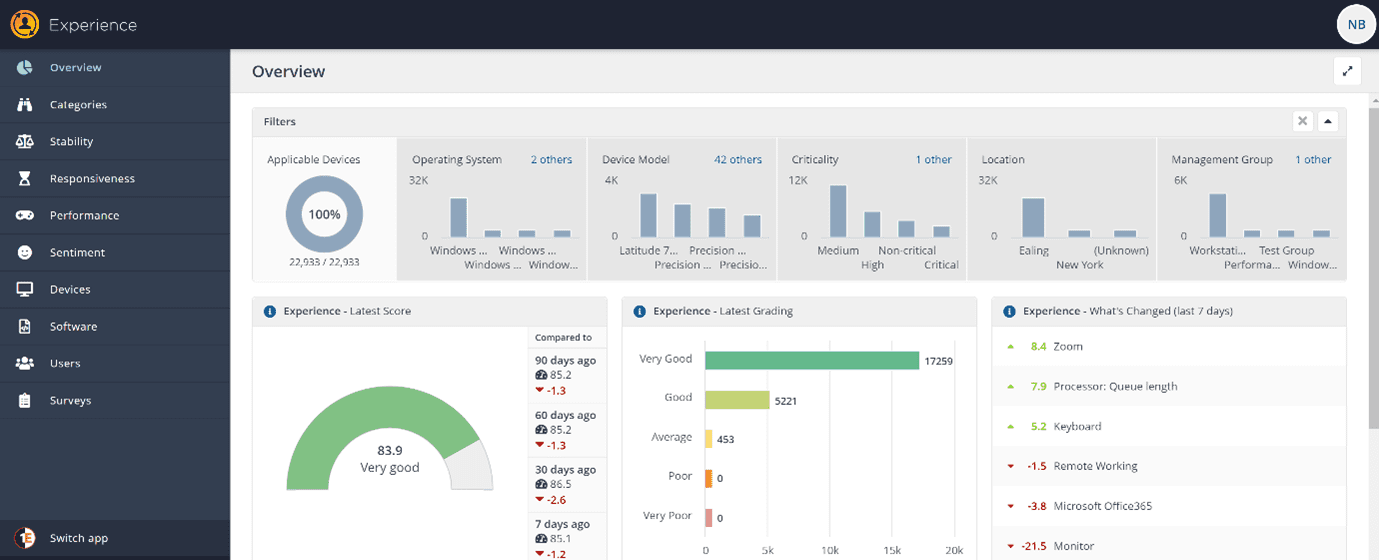
There is an immense amount of work proactively done for a L3 Admin in this dashboard, and it is beneficial to fully understand the metrics and data available to you. There are a number of filters that may be required. Be sure to consider the relevant factors: the device model, specific OS Version, the particular group of machines per their criticality level (think Servers or VIP machines), devices based on location, or simply your own custom defined Management Groups to slice and dice system information in your environment. It’s all available at a point of a ‘click’.
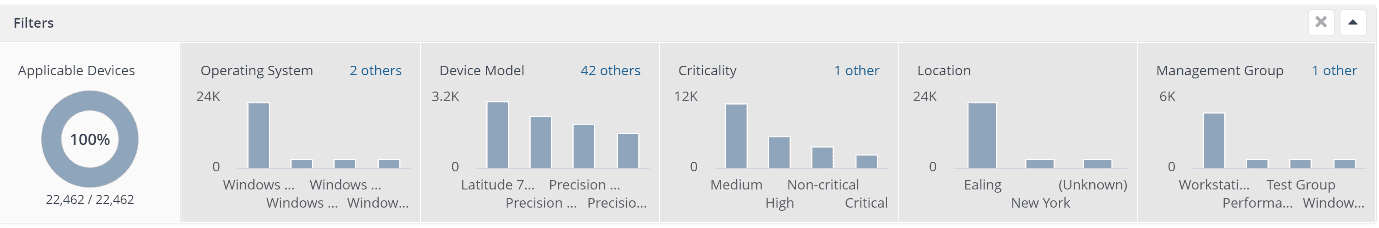
Choosing any of your preferred filters will update the latest metrics in the dashboard to show you environment-wide deviations (negative or positive) on the metrics you are most interested in. Let’s dig a little deeper:
Experience Latest Score: This tile shows you an environment-wide score that provides a weighted indicator of device performance, stability, responsiveness, and user sentiment.
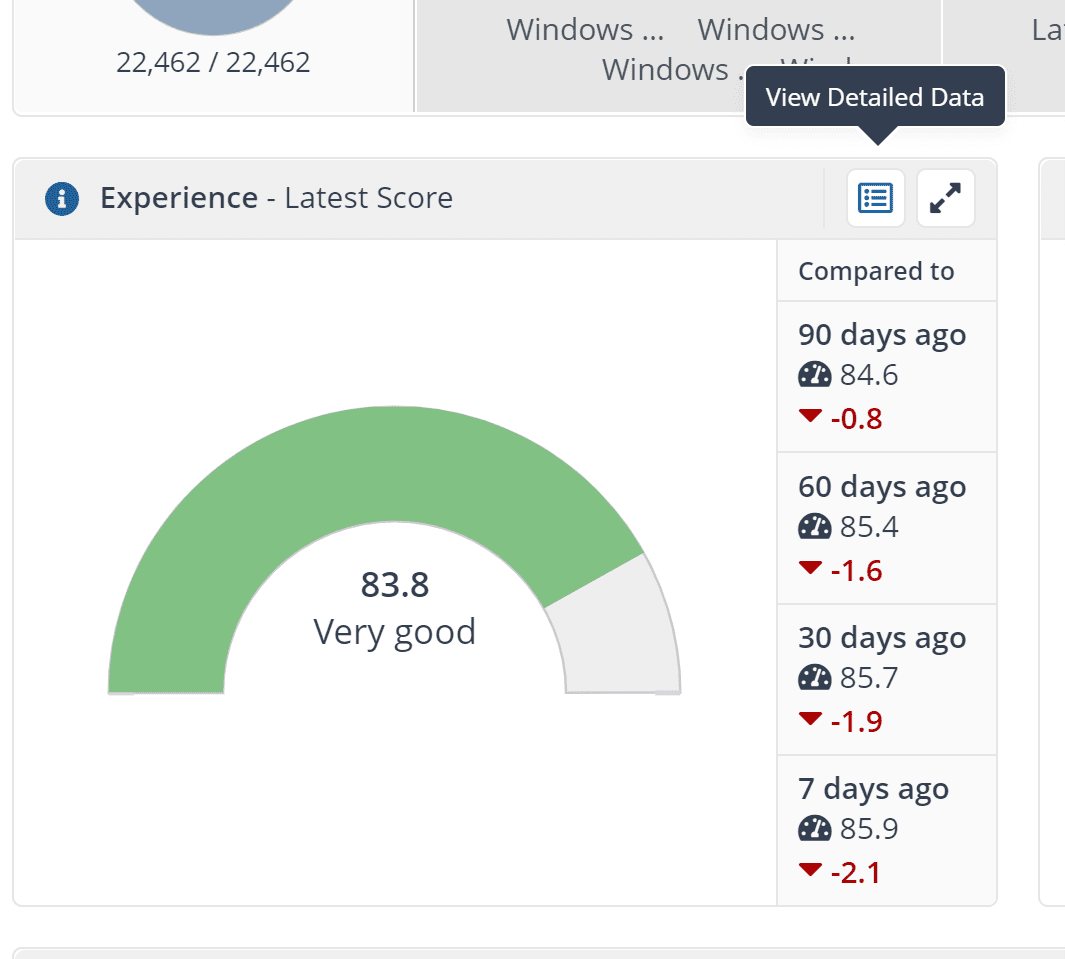
It will provide the average score of devices in your environment, and also details how the overall score has changed in the last 30, 60, 90 days or the week prior to you looking at this dashboard. Here, you can learn more by clicking on ‘View Detailed Data’ to understand the devices that are performing below the standard. You can also click on the tile to go further into specific experience metrics.
Experience Latest Grading: This tile complements the data of the previous tile by providing a breakdown of the number of devices based on their experience ratings.
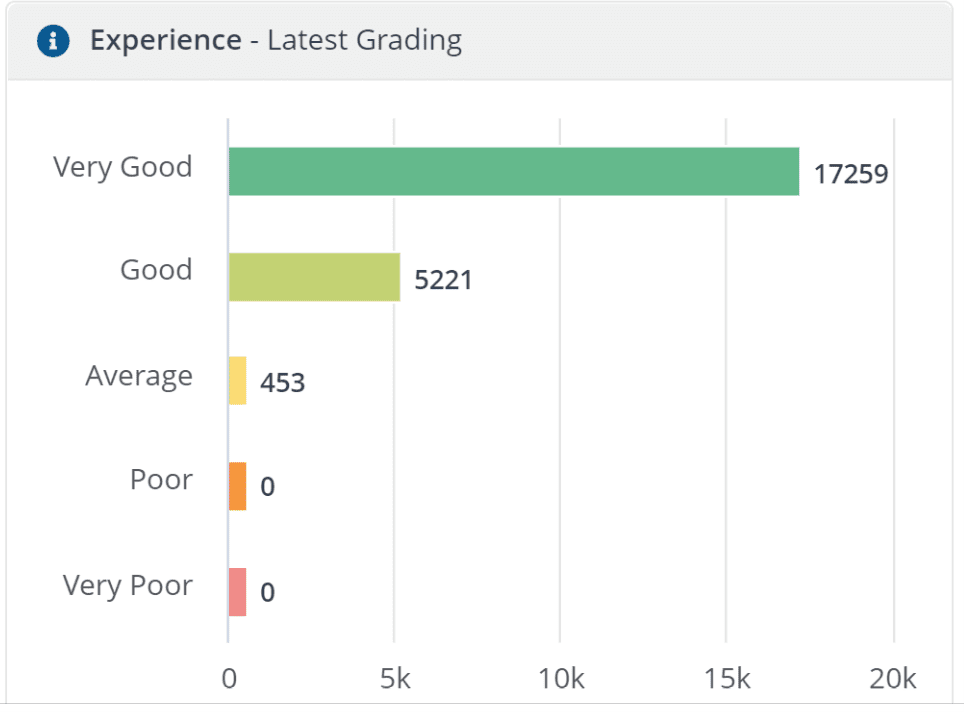
Now, we can easily focus on the devices we really care about based on their grading.
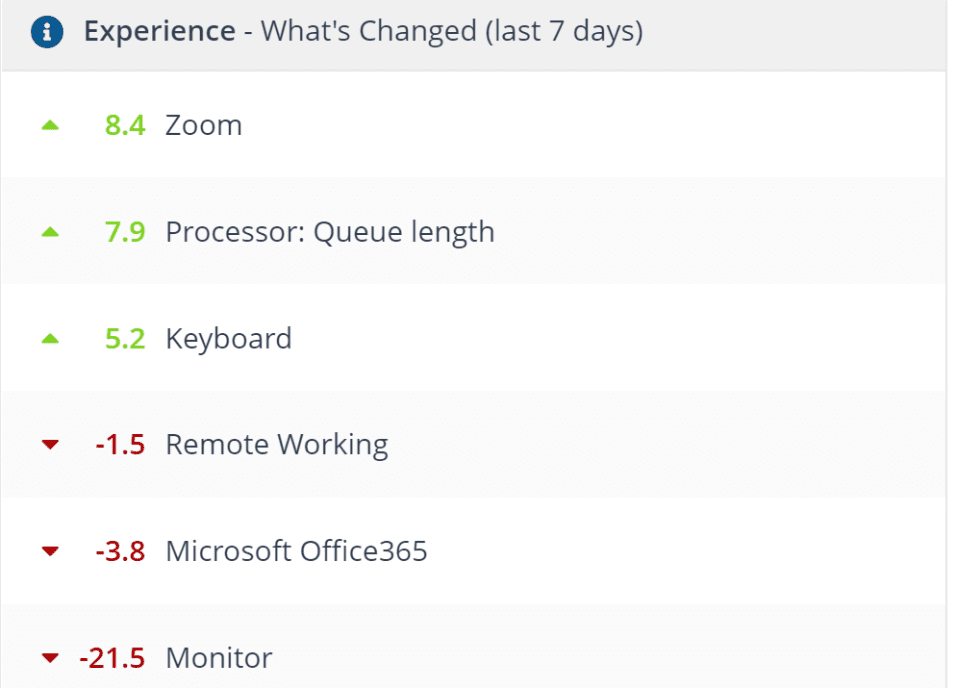
Experience What’s Changed (last 7 days): This screen is a great pathfinder as it highlights the most significant changes within your environment over the last 7 days. More importantly – other than the data about ‘Devices’ – this tile also includes ‘User Sentiment’ data based on automated surveys and can provide key insights into user perception of your IT environment.
The data provided in these tiles goes a long way in eliminating guess work, helping you to easily identify problem areas, and saving you tones of time. Additionally, by enabling you to gain insight into user perception of IT support, you can showcase team successes to IT leadership.
2. Painting a Clearer Picture
Let’s look at how to investigate wider issues that usually cause a lot of frustration due to the lack of quality data to support troubleshooting. Continuing with our example, we’ll navigate to the Software screen:
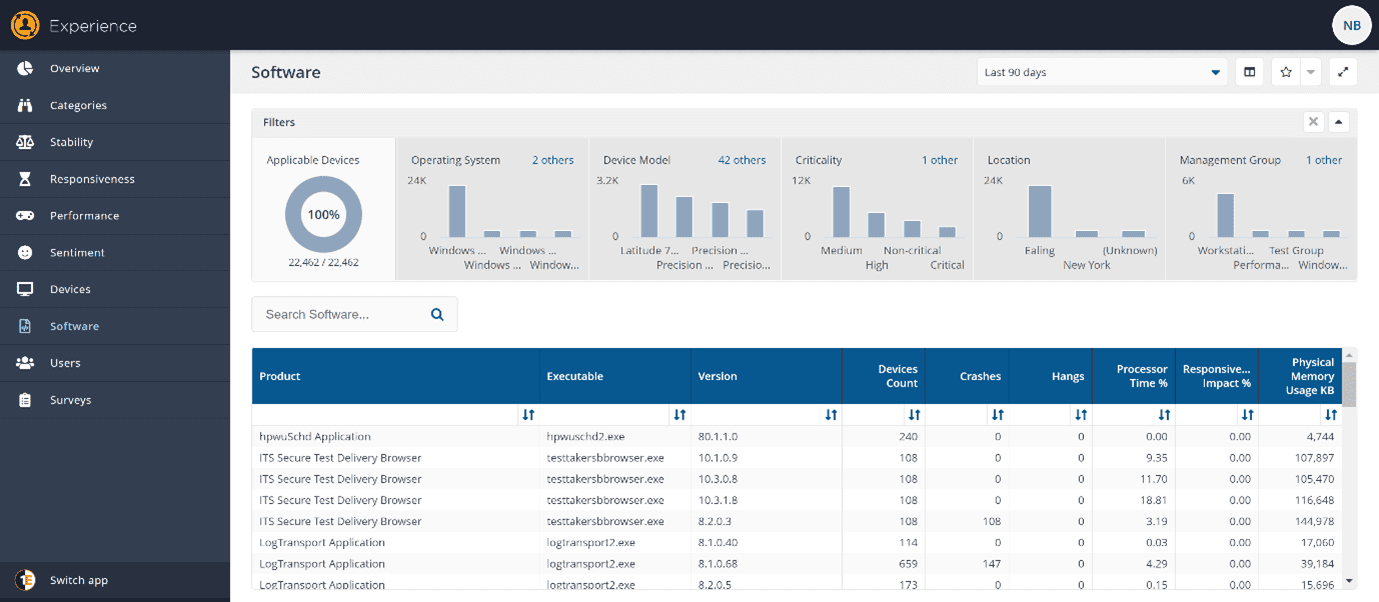
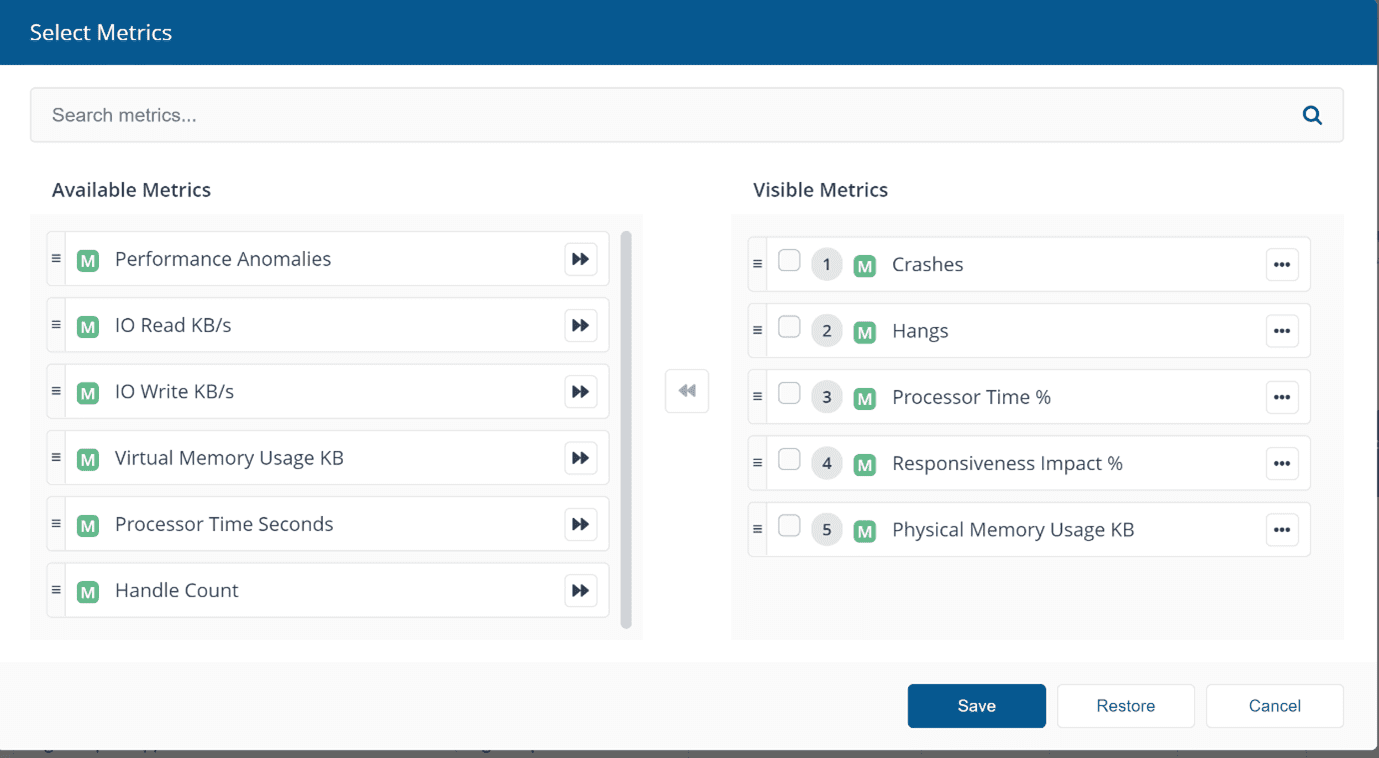
Here you have the data to filter down to any particular Software, Driver, Patch, Application, or OS version and understand the impact that it is having in your environment. You can quickly sort the data with default choices such as number of software crashes, software hangs, or a metric of your choice that you can add per your preference.
Once you have chosen what metrics you are interested in, you can examine the problematic software from the first screen above. We saw that Microsoft Office experience has changed negatively by 3.8%. By filtering to Microsoft Office in general you can find everything under that software title and see how it is behaving in your environment.
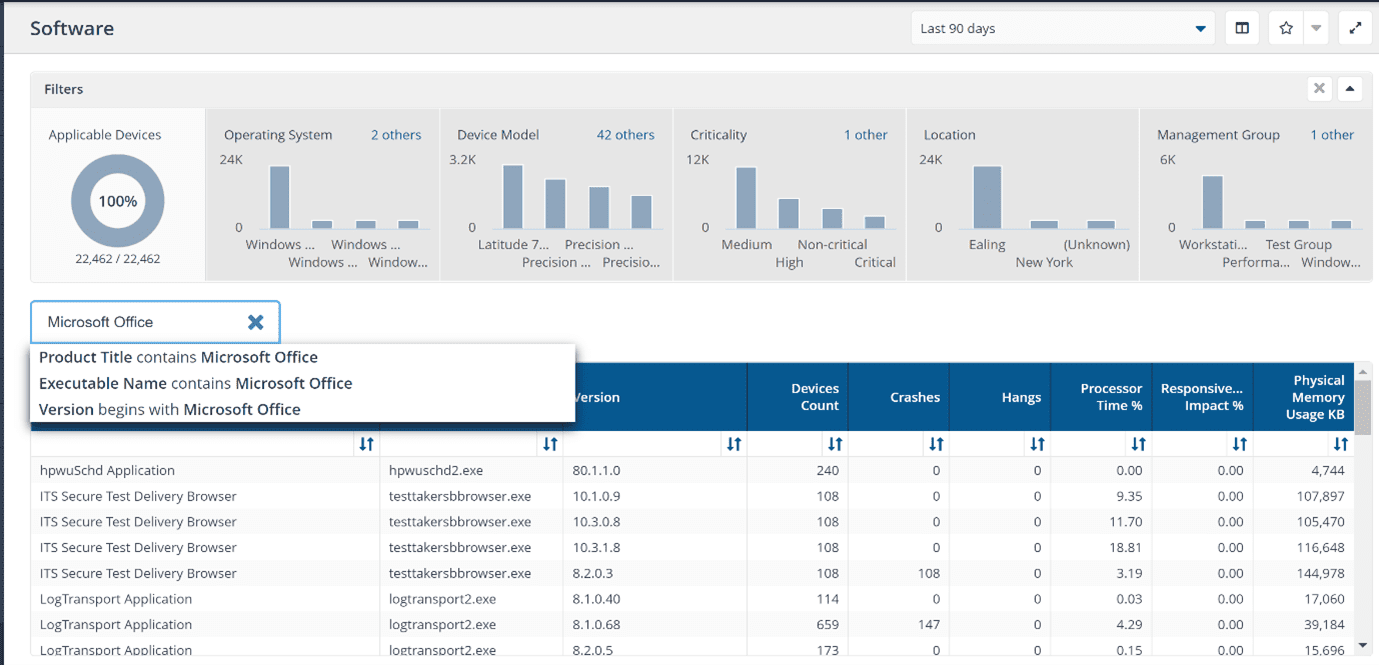
In the screen below, we have a much clearer picture of what’s going on. The selections made to quickly identify the software degrading ratings has been highlighted in red.
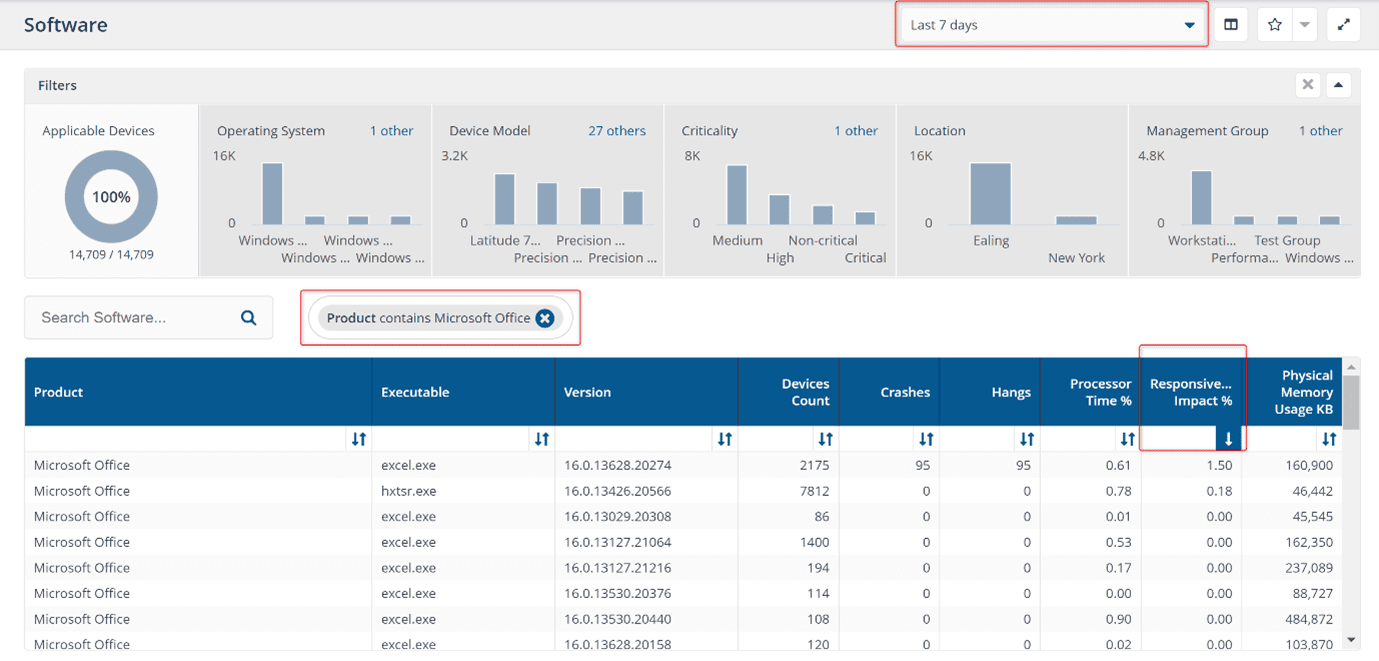
By searching for Microsoft Office products and then narrowing data to the last seven days, specific data on what crashes or hangs are happening are shown with these specified criteria. But how do we then know which software crashes or hangs are causing user frustration and which are just normal operations that auto-recover? (For example: Outlook crashing and auto-starting itself is not as impactful to the user as an Excel sheet hung on some VBA with frozen screen). Now, a unique metric that 1E Platform is providing is the ‘Responsiveness Impact’, which is based on underlying Synthetic Microtransactions that tells the admin how much of an impact a piece of software is having on the device and user experience.
Here, we can see the specific office component from the Microsoft Office module with exact version number and the number of devices it is installed on causing the maximum impact to the user. We can use this data to justify a remediation action such as a hotfix, a configuration change, an update, or a replacement of this software – all of which can be performed within the 1E Platform itself.
3. Automation is the Future
and the 1E Platform is designed to support this initiative.
In the preceding blog post, we understood how to apply a fix to a specific user, device, or groups of machines using 1E Platform ‘Actions’.
Being an L3 Admin myself previously, I know there’s always that nagging feeling – even when we have a fix for a known issue. Did I apply the fix to the entire estate or only the problematic machines? What if a new machine comes online with the same issue? What if that is a VIP user? Do I have to repeat the fix endless times from now on? Write a new build guide or KB Articles for manual interference?
With the 1E Platform, you can proactively apply any identified fixes to only the machines that have the issue and to all future machines that may have the issue. When did we stop believing in magic?
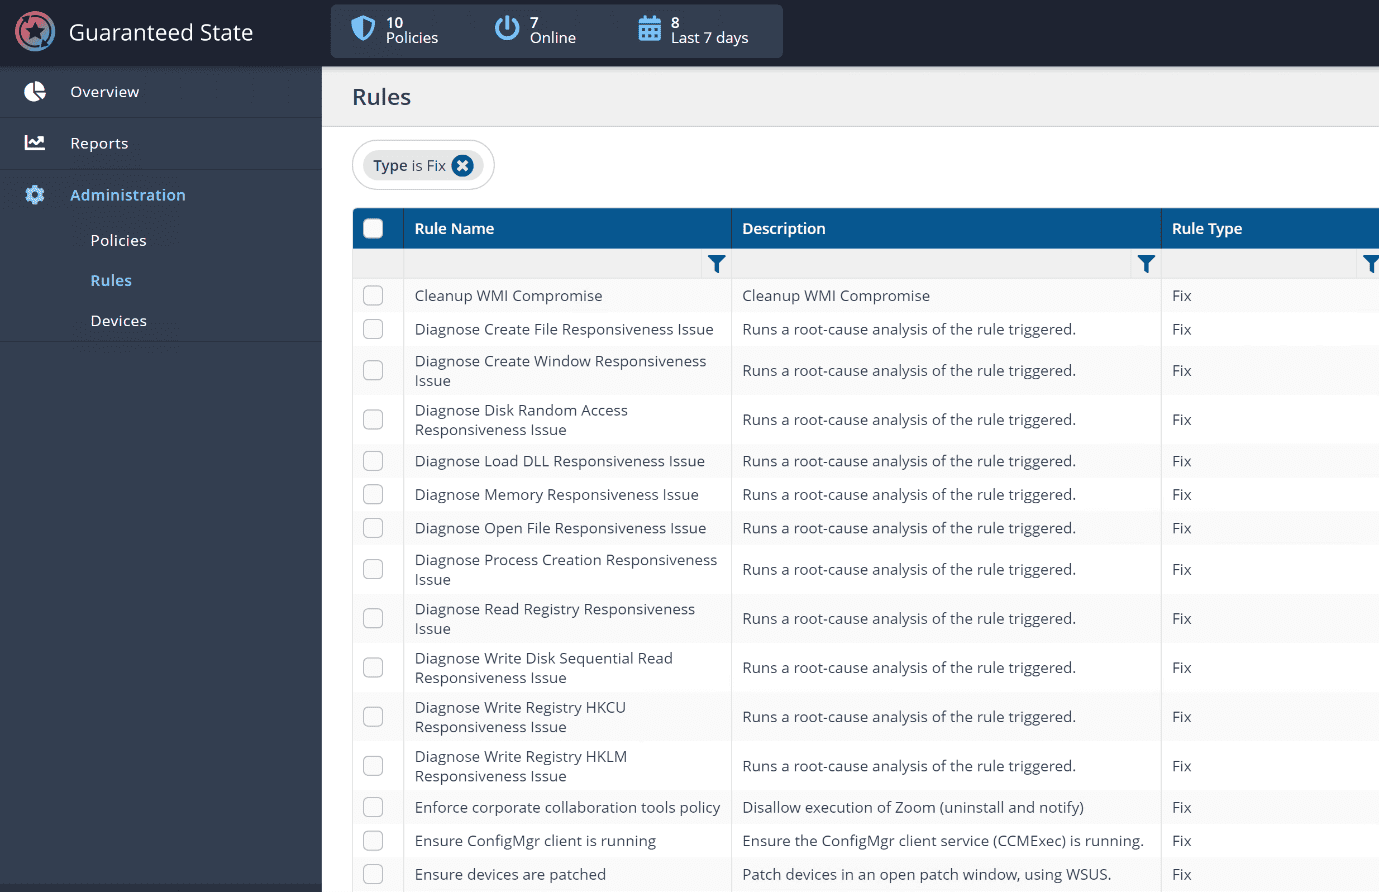
This is achieved via the 1E Platform’s ‘Guaranteed State’ feature that allows you to set ‘Rules’ which will check for a predefined condition and ‘Fix’ it if that condition has a match. The ‘Rules’ are extensions of the 1E Platform ‘Actions’ that an L3 Admin has identified as repeated fixes and must be applied throughout the environment – ensuring those issues NEVER happen again. The ‘Guaranteed State Rules’ provide the flexibility to run on various varieties of ‘Triggers’ as the L3 Admin deems suitable in their environment. Examples include (but not limited to) Service start/stop events, Windows Events, Executable launch, Time Intervals, etc. Another benefit of applying ‘Rules’ is to reduce the number of tickets raised with L1/L2 analysts for common issues.
Here’s a glimpse of some of the Out of Box remediation capabilities included as part of the 1E Platform Automation:
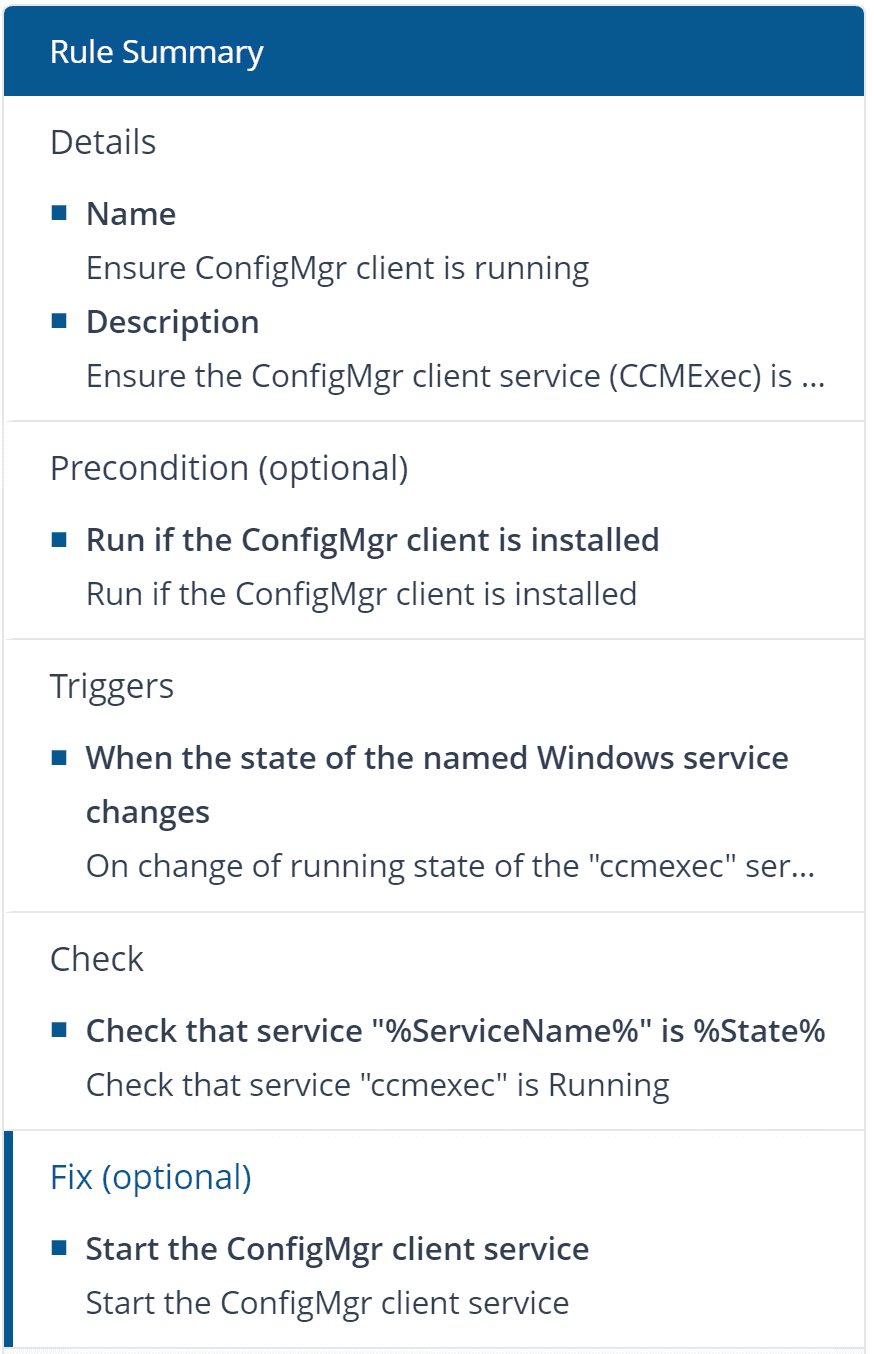
Here’s a detailed view of one of the Rules:
As an L3 Admin, you may want to use a combination of some out-of-the-box remediation and build your own to extend and tailor the remediation per your environment. This will allow you to fully automate the issues you identified in the environment and target them proactively.
Using these set of rich 1E Platform capabilities, an L3 Admin can provide a level of customer satisfaction never experienced before in the organization. This also helps to set a great leadership example to the L1/L2 Analysts via modernization and reduction of repeated manual work.
To see the 1E Tachyon Platform in action, you can book a demo here. To learn more about how our solutions solve real business challenges, take a look at the Tachyon Masterclass.
?")

