
Dashboards are a popular way to understand the benefits provided by NightWatchman (NWM).
They’re attractive and to-the-point so that anyone can immediately get it, such as “we saved $1,023 on Wednesday”. But that can also quickly lead to questions, such as “why did we save less on Thursday”? Or “where did those savings come from”? For that reason, it’s important that NWM administrators understand how dashboards work. In this post I’m referring to the default Enterprise View dashboard. Given that it’s freely available to all of you – no custom work required.
In particular, let’s look at the “Daily power cost” tile:
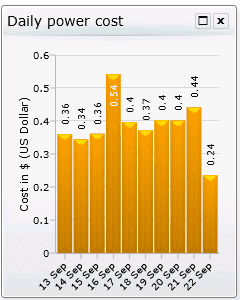
How does the tile know all that?
What if we do want to know more about the costs? In this case, you’d run the “Weekly NightWatchman savings” report (how we know that is explained below). The breakdown between desktops and laptops is provided. You can select a specific organization or location groups to find out where those costs are mostly coming from. And you can look at different weeks to see how this week compares.
How do we as administrators know that the tile works that way?
The dashboard tile is defined in the file NWMDailyPowerCost.xml. In the XML we can see the tile calls the stored procedure pNWM_Dashboard_DailyPowerCost to get the data, which in turn calls spNWM_Report_ActualCostFromTier_Daily to get the root data. We can read each of those to see what formatting is done along the way and to see specifically which tables the data comes from. Not too surprisingly, tbNWM_Report_Consumption_Daily is the data source, though a bunch of other tables is referenced for tariffs, computer models, etc.
With a bit of sleuthing, we can find that spNWM_Report_ActualCostFromTier_Daily is also called by the spNWM_Report_BaselineSavingsFromTier_Daily stored procedure. This is the source of the data specified in the NWM_SavingsDailyFromBaseline.rdlx report definition. From that file, we can also see that in the reporting console this report goes under the “Savings” category, and then “Savings from power behavior”, with a friendly name of “Weekly NightWatchman savings”. When we run that report, we do indeed see details that correspond with the dashboard tile.
Learn more about NightWatchman here.


