
One of the best things about working in 1E is that no two days are ever the same. Take, for example the Tachyon Exchange, if you’re not familiar, do go check it out. There you’ll find hundreds of instructions and rules covering a plethora of technical areas.
1E partners and customers can create their own extensions to Tachyon, but on the Exchange they can also take the “lazy route” and request a new instruction, rule, or policy to be created for them. It’s a great way for us to garner ideas and ensure we’re creating content that will deliver value.
One such example was a request to deep dive into resource utilization in a new way. Tachyon Experience has ever improving and very impressive analytics, but one of the real powers of Tachyon is its extensibility – which can provide you with new automations, augmentation capabilities, and/or new analytics.
The request was to be able to identify changes in resource utilization by product over time. The initial goal was to identify if an update increases or decreases consumption of CPU, Memory, and IO – and by how much.
Tachyon understands “Products” as well as “Processes”. A product like MS Teams is made up of several processes, including “update.exe” – so we can see in the graph below that on March 23rd a lot of devices were upgraded. When we looked at the data a week later, we could see that the consumption of ALL resources, CPU, Memory, and Disk I/O was improved by the upgrade.
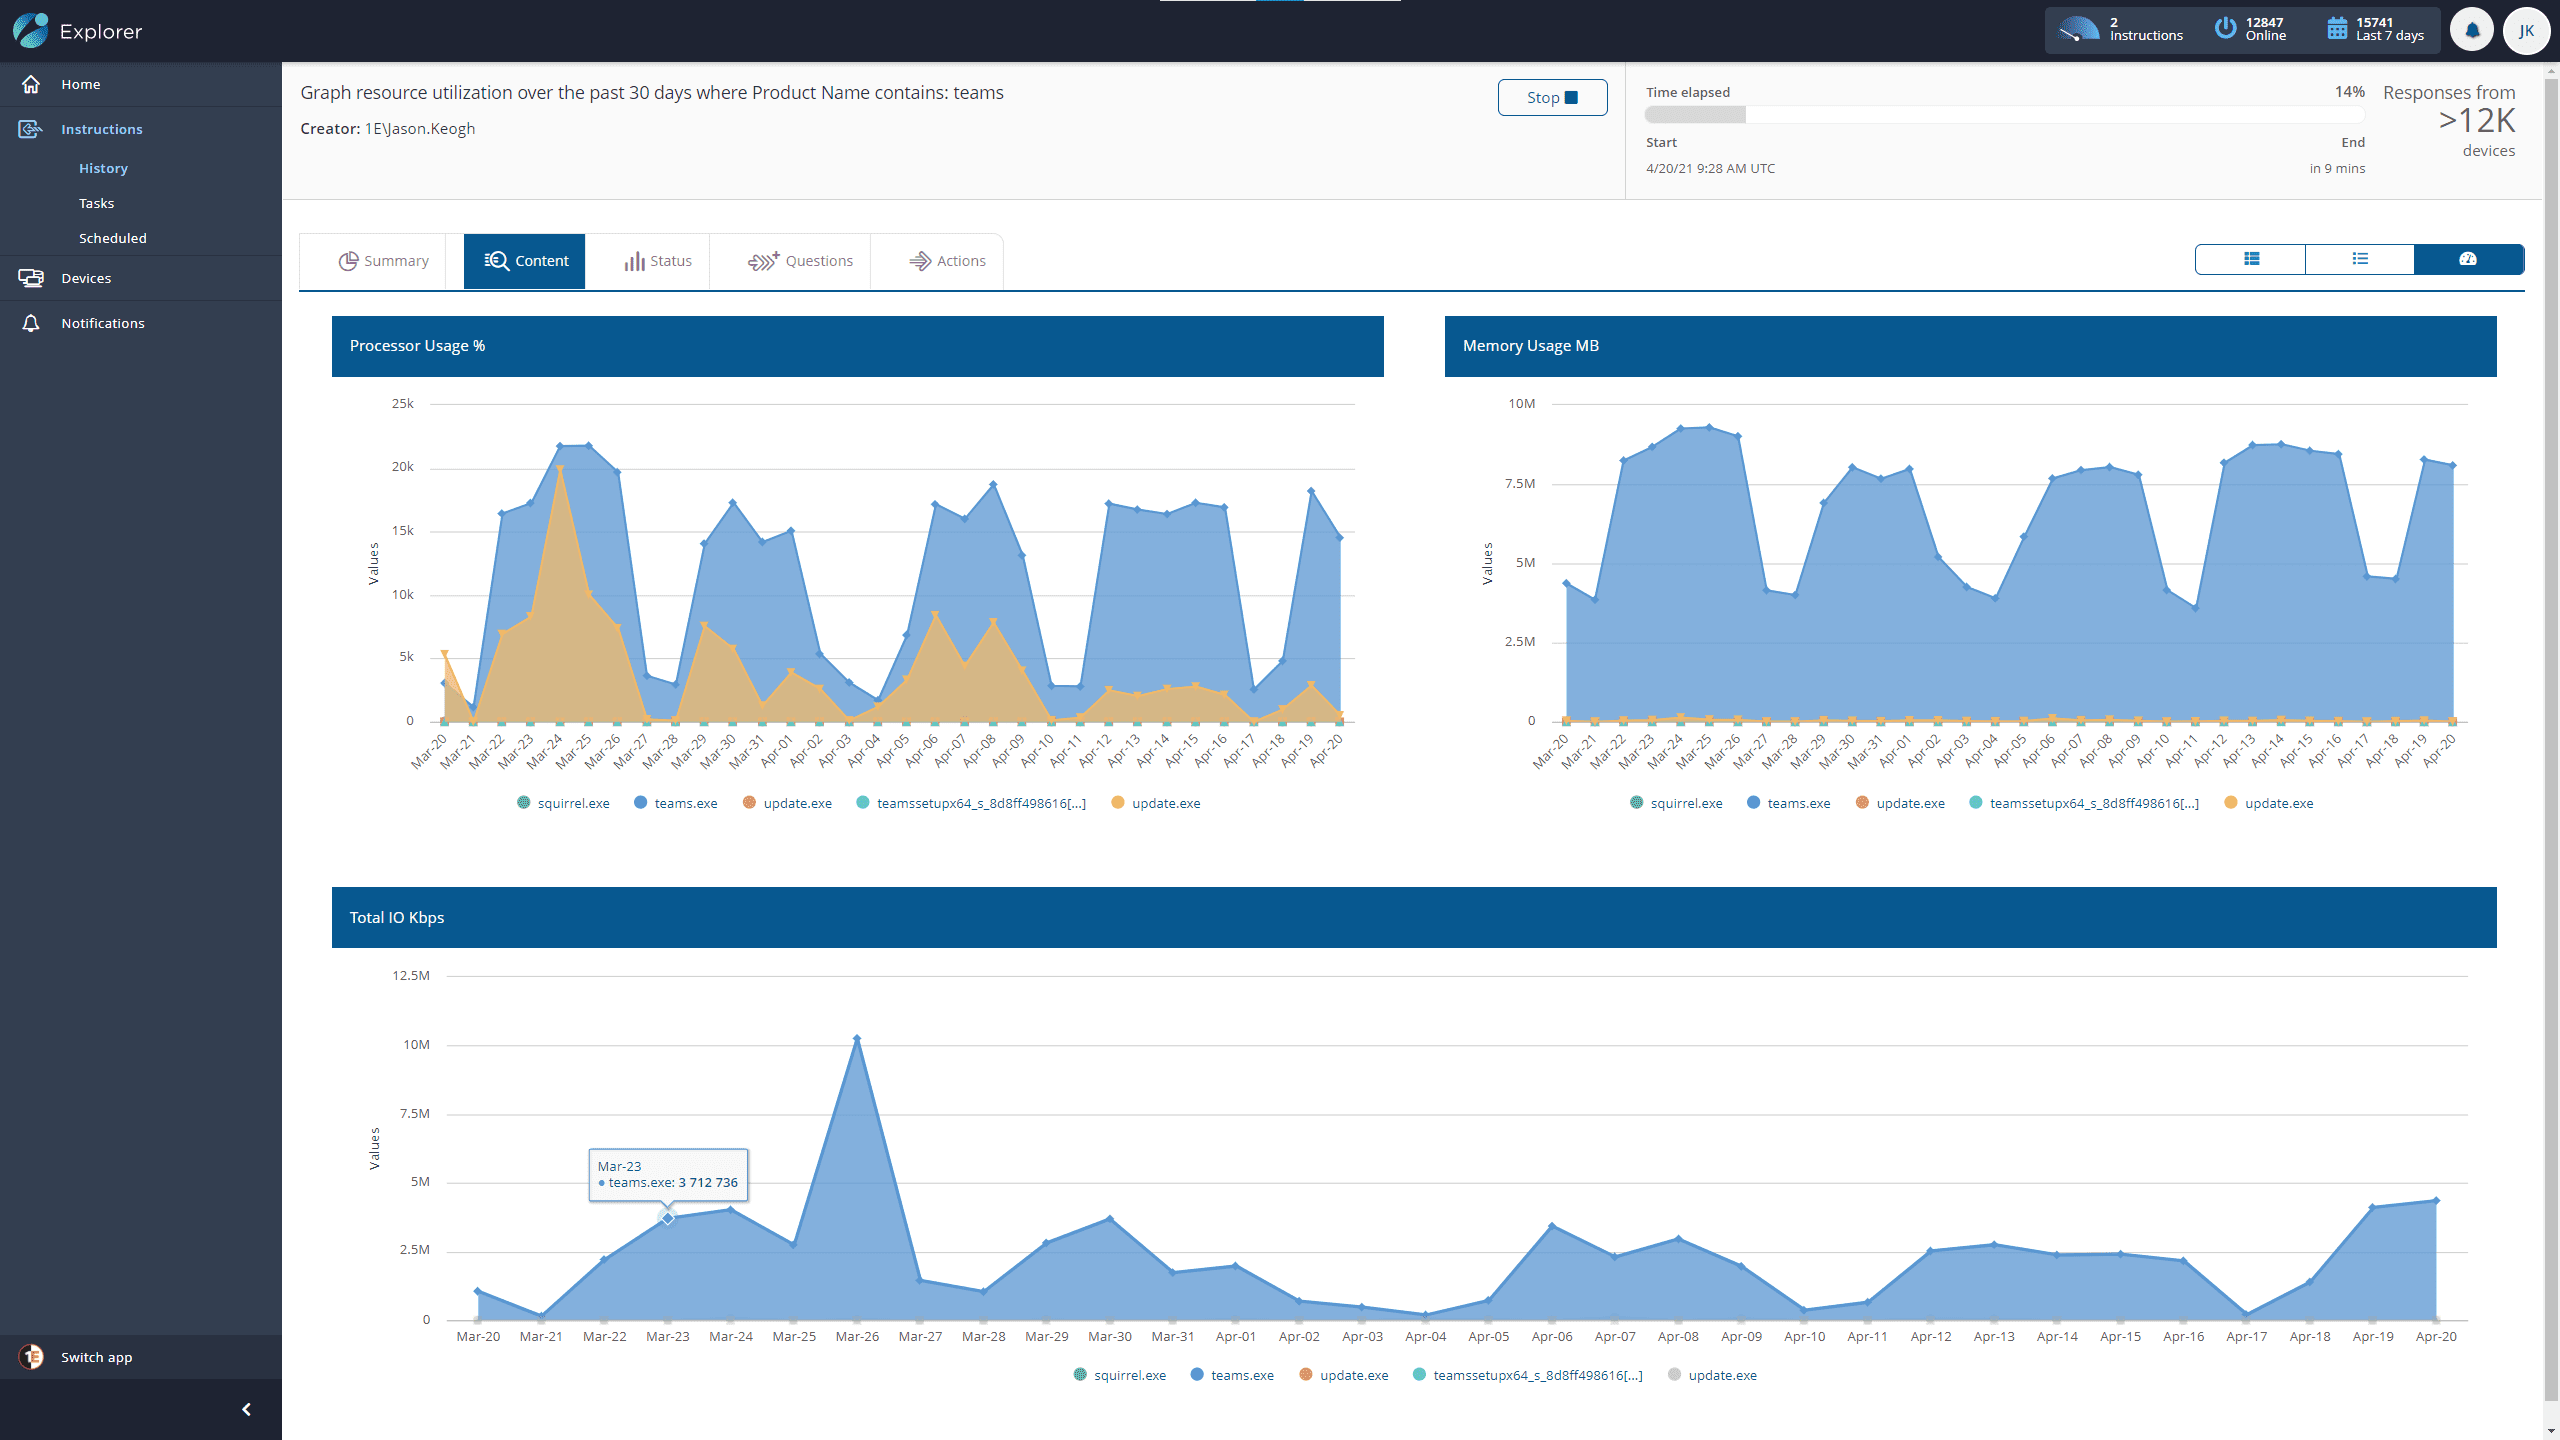
Current Status of Teams resource utilization, note the upgrade 4 weeks ago…
As often happens, once we saw what was possible, we were able to pivot the same data and analysis to see and understand more…
For example, if we put "%" instead of “Teams” into the search for Product, the instruction returns ALL titles. What was interesting then was to see what was taking the most resources.
As you can see below, the 'top consumers' section now featured “compattelrunner.exe” in CPU and IO and – while Outlook and Chrome were in the list of top memory consumers – running services, anti-virus, and security tooling stood out in the list also:
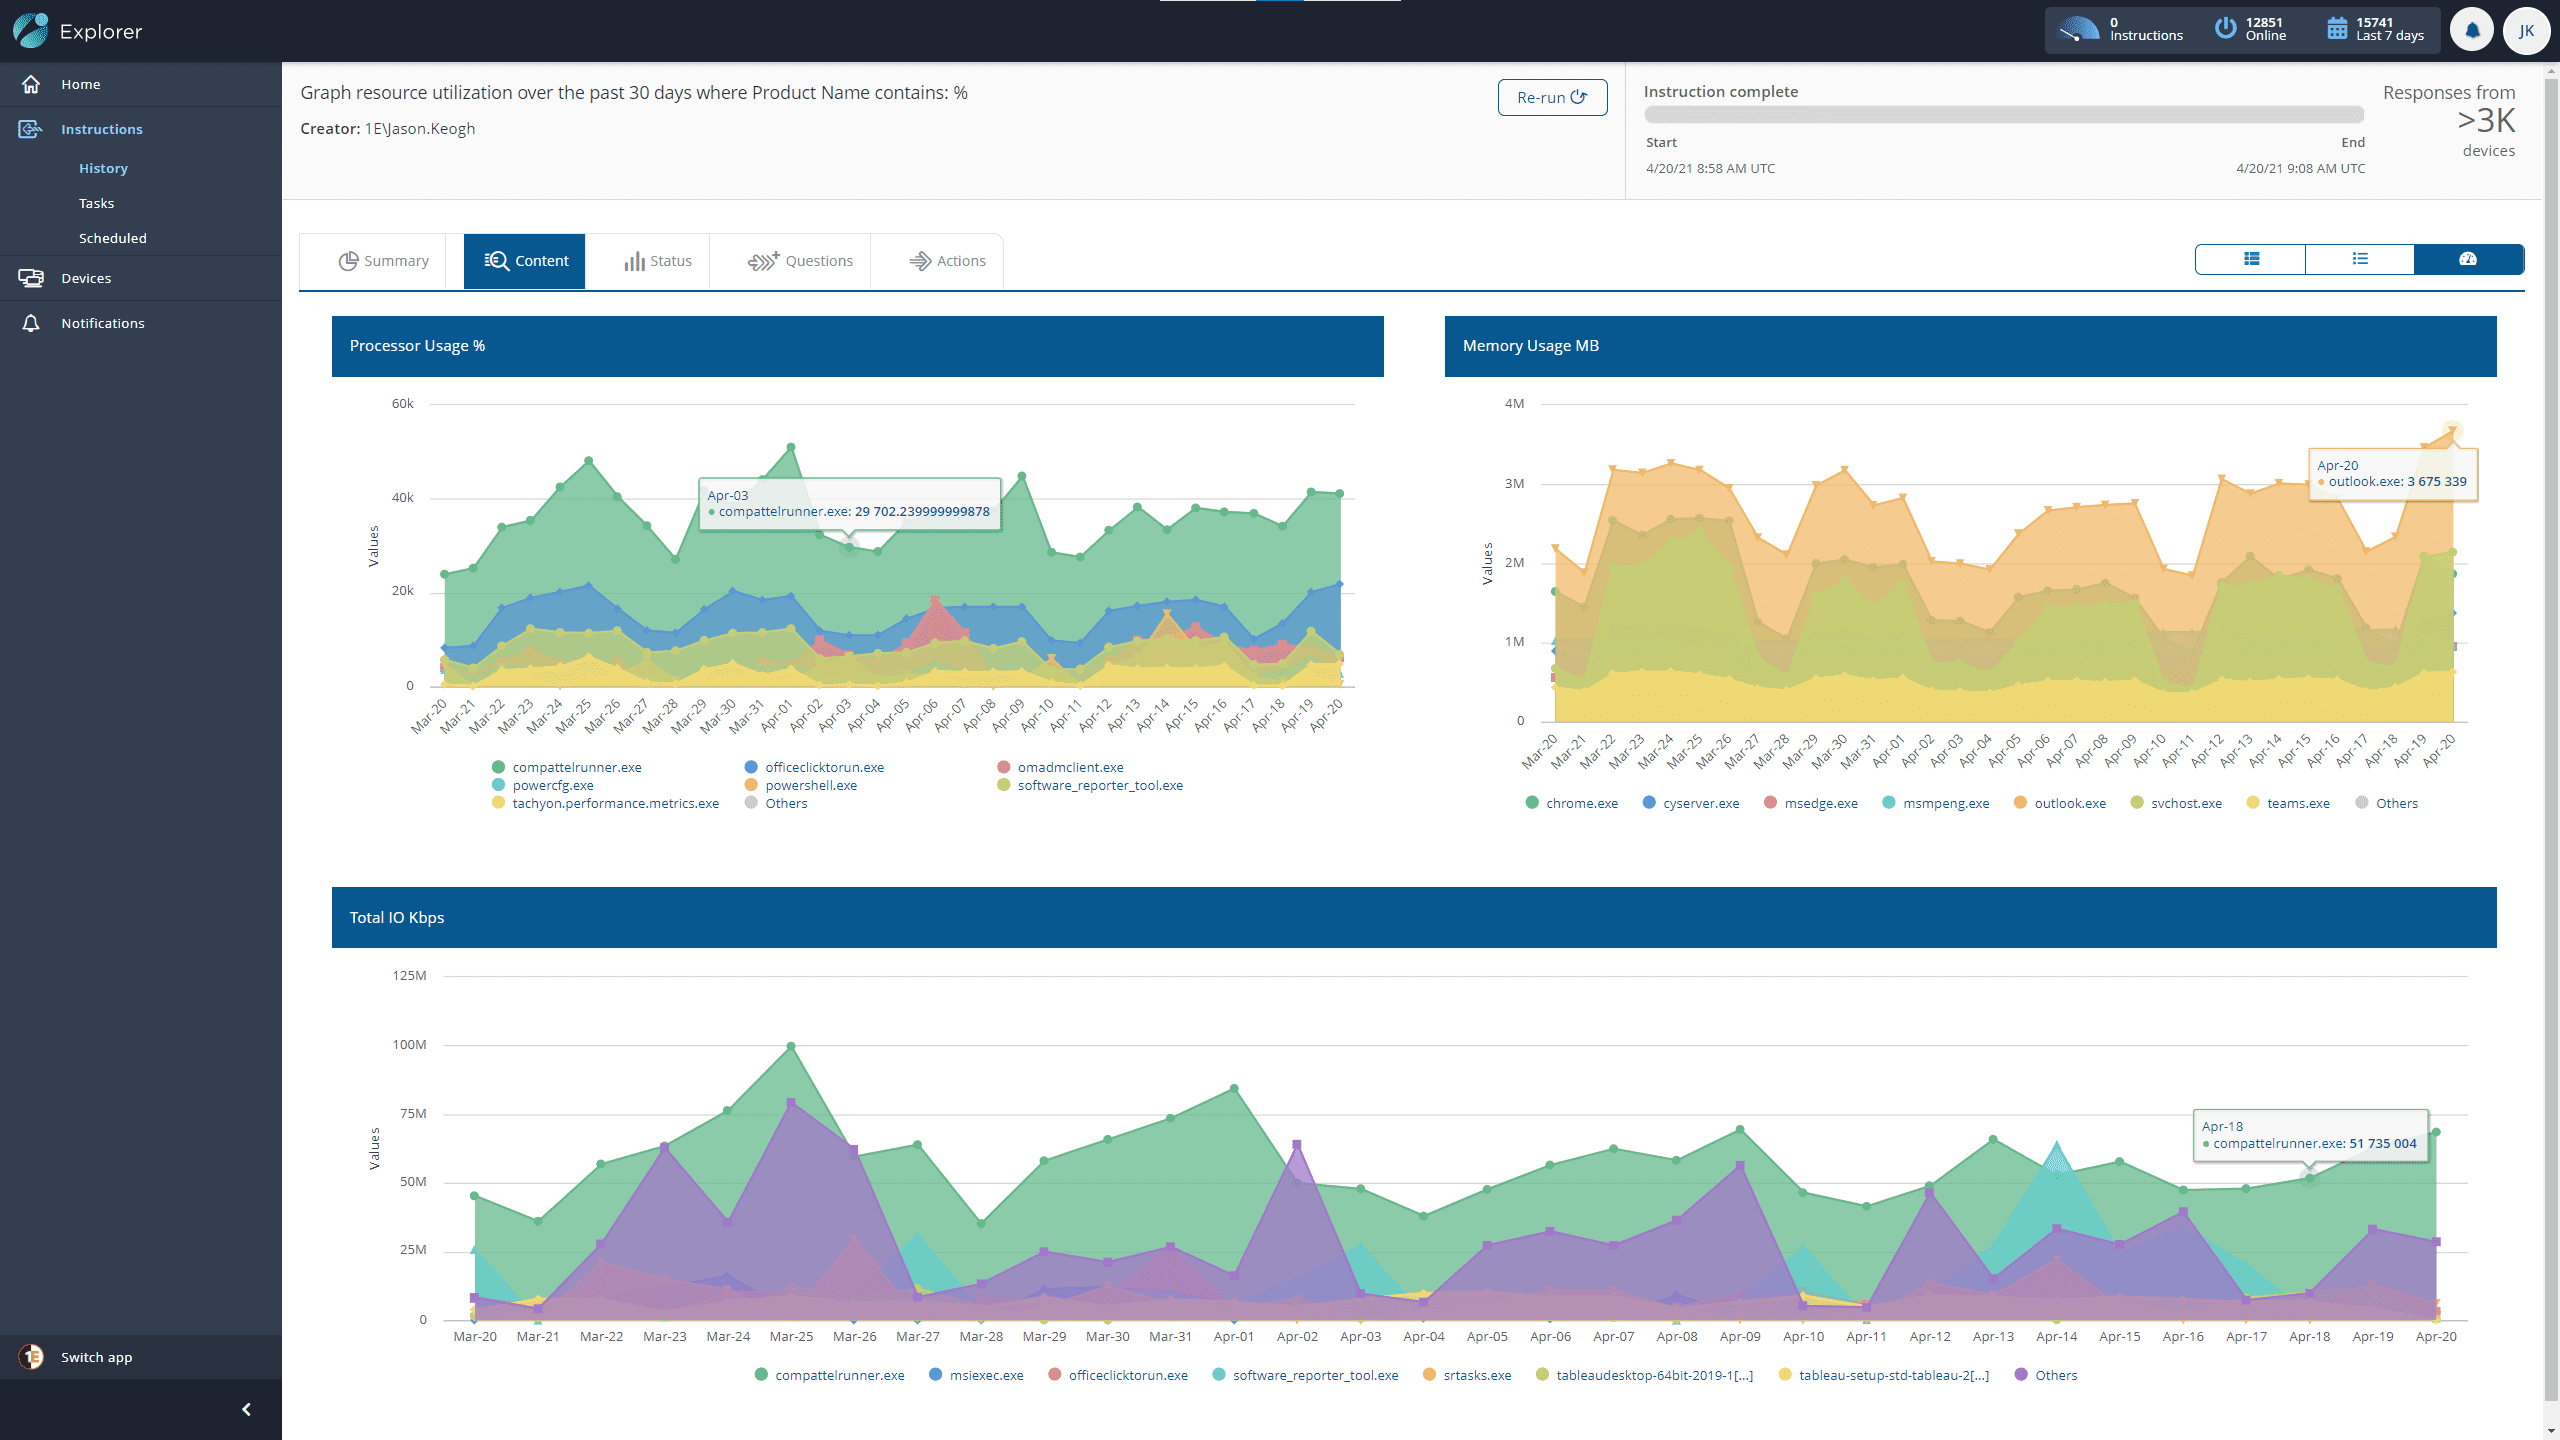
That, in turn, led to further analysis and further insights – for example, a Google Chrome feature, called “Software Reporter Tool” which is taking a LOT of resources, but not providing value to the customer (perhaps providing value only to Google!).
Several configuration changes have been identified as a result of this request, which can lead to a reduction in overhead and improvement of end-user device performance – which ultimately is what it’s all about…
If you'd like to learn more about Tachyon, check out the Tachyon Tuesday series here. And be sure to keep your eyes peeled for Jason's follow-up vlog next week where he'll explore the topics of this blog in more detail!


