As discussed in previous blogs (Is Power Management Different on Modern Devices?) and other materials, Deepest Runtime Idle Power State (DRIPS) on your modern tablets, 2-in-1’s, and similar devices doesn’t always work properly. NightWatchman 7.1 gives you the reports to centrally determine where that’s the case. What do you do next?
We’ll answer that question in a moment, but to review you should:
- Open your NightWatchman report console
- Go to the “Lowest Power State” Power Optimization report
- Review the computer models to determine which have “components not idling”, “software polling too frequently”, and “software polling too infrequently”
- You might look at specific business units or locations for unique issues
You now know that you have a problem. You should find examples of relevant computers. On them, open a command prompt and enter the command “PowerCfg.exe /sleepstudy /duration 28”. That will generate a sleepstudy-report.html. Open it in your favorite web browser.
Now you can get to root causes. Not far into the report you’ll see a table of connected standby sessions with headings such as “start time” and “duration”. Ideally the rows should be like this:

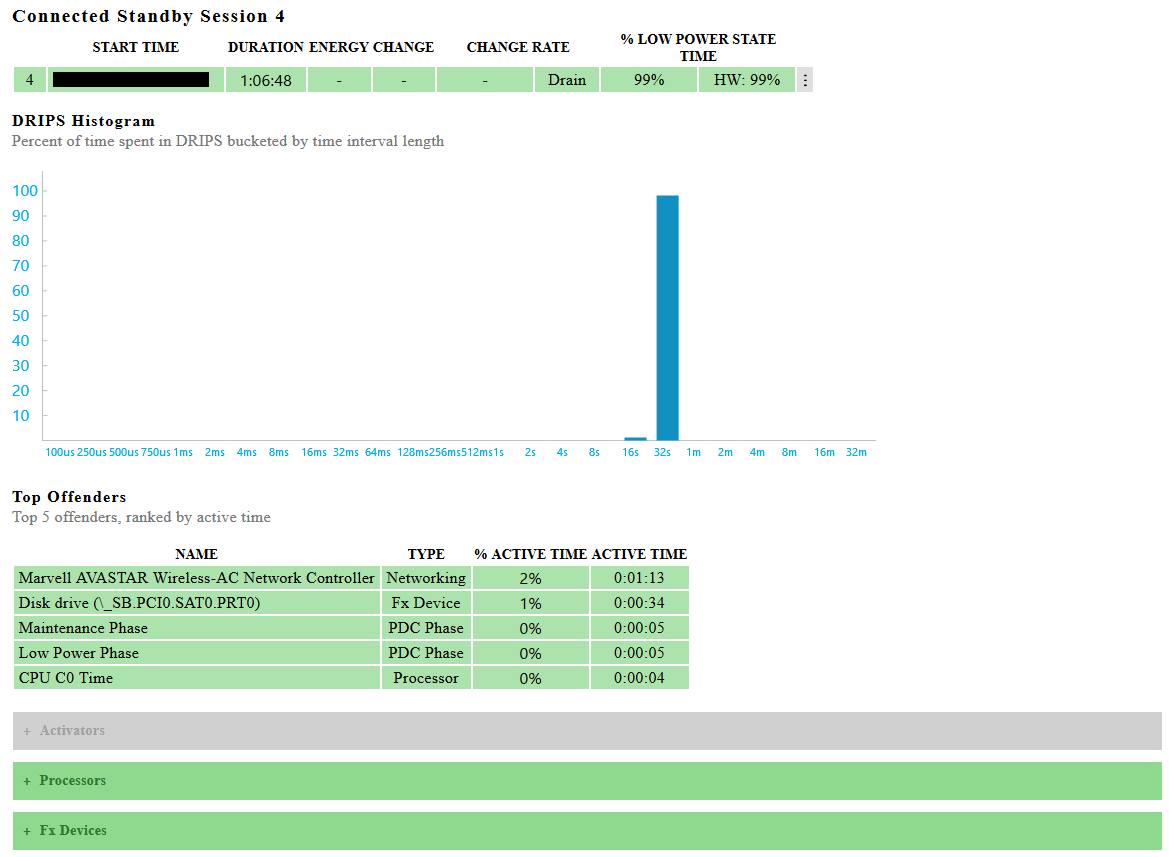
During this session this device was in “low power state” (DRIPS) 99% of the time. And the “HW” indicates that DRIPS was enabled by the hardware, which is ideal. If you click such a row you’ll jump to a section of the report that looks like this:

Now we can also see a histogram that shows how frequently the system checked for e-mail or similar non-realtime data during the session. In this case there was a lot of checks about every 32 seconds and a few that were every 16 seconds. There were none that were excessively frequent (far left) or excessively rare (far right).
The “top offenders” are really the consumers of power during the period. Even the worst of these, the Wi-Fi NIC, was only active 2% during the period. The various components of the system (activators, processors, FX devices, etc.) are all green (good) or grey (not used). So this system is behaving as desired.
However, you’ll also see examples such as:

Session 10 is bad: lots of battery drain (over 2% per hour) and the system didn’t get into DRIPS at all (0%) even though it was on standby.
Session 11 is red but not nearly so bad – it was in DRIPS 97% of the time, just shy of the ‘acceptable’ 98%.
Session 12 does get into DRIPS 98% of the time and thus is orange. I wouldn’t worry about this session or session 11.
What happened during session 10? Well:

Drilling into the “Fx Device” section below this doesn’t say anything more in this case. An “Fx Device” is a power management framework component and in particular is related to the graphics (display) controller in this case. So the most likely solution in this case is going to be to check with device vendor to see if they have an updated device driver for the graphics subsystem, or possibly for power management.
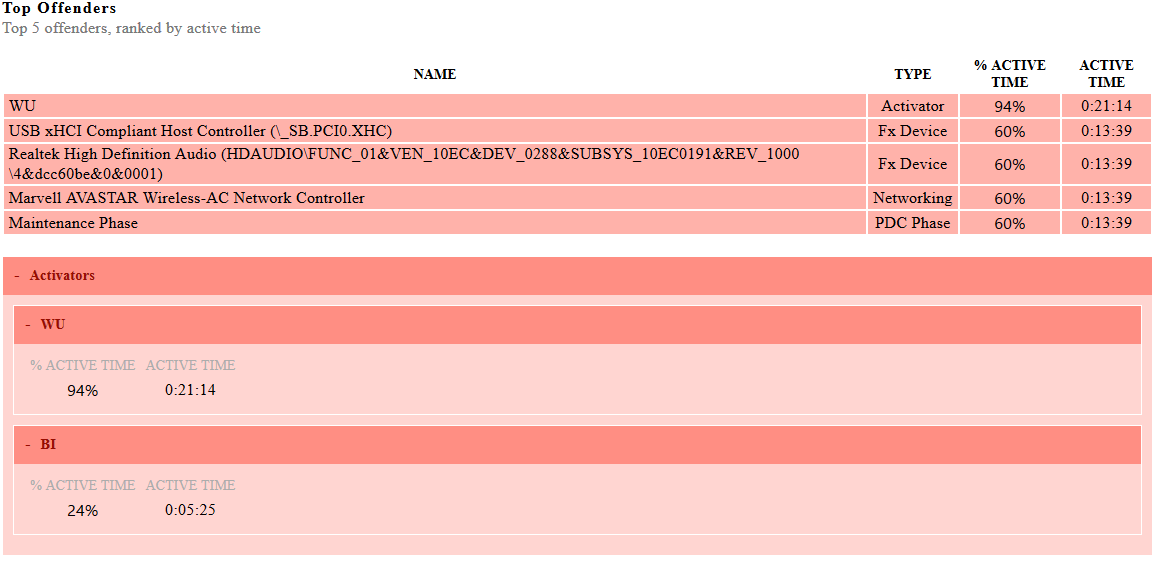
In other cases you might see sessions such as this one that also got 0% DRIPS during standby. Drilling in, we see:

“WU” means Windows Update, and drilling in to other “offenders” confirms that the “PDC Phases” (for the power down controller) was 60% in maintenance mode, and the NIC and disk were used a lot. So the system was doing some regularly scheduled patch management.
You won’t see examples like this nearly as much in investigating Power Optimization issues because they’re one-off issues. Hardware related issues will standout because they occur during every connected standby session (or at least most of them).
There’s obviously more to this topic and we’ll get into it in other blogs, whitepapers, NightWatchman documentation, etc. The key point for now is that you can see how actionable Power Optimization data is. With just a little effort you’ll be giving your organization’s users the smartphone like experience the modern device vendors are promising!
In the meantime, to learn more:
- Overviews
- Details


