
Understanding the end-user experience has always been important. However, the true benefit is not just in “Digital Experience Monitoring” – but rather in leveraging the data from that to better manage devices. The goal must be to identify issues on a small number of devices as they happen so that you can mitigate against those problems occurring on a large number of devices.
DEM+
Our Tachyon Experience module goes beyond Digital Experience Monitoring to also include Management and Remediation. That’s why we like to call it “DEM+”.
To have the monitoring capability without the associated “plus” is to have knowledge without the ability to act. That’s possibly even worse than action without knowledge. As with most things in life, it is when you marry good data (knowledge) with the ability to act appropriately that you get the best results.
The four parts of this series are as follows:
- Identifying Stability issues in a WFA environment
- Identifying Performance issues in a WFA environment
- Identifying Responsiveness issues in a WFA environment
- Gauging end-user sentiment in a WFA environment
When first using Experience, you can be somewhat dazzled by the pretty graphs and the ability to extract useful data (and from there to perform useful actions) can be less than obvious, but rest assured, there’s lots of depth to the data and valuable insight to be gained.
In the menu, beneath each category of Stability, Responsiveness, Performance and Sentiment, you can see “Software”.
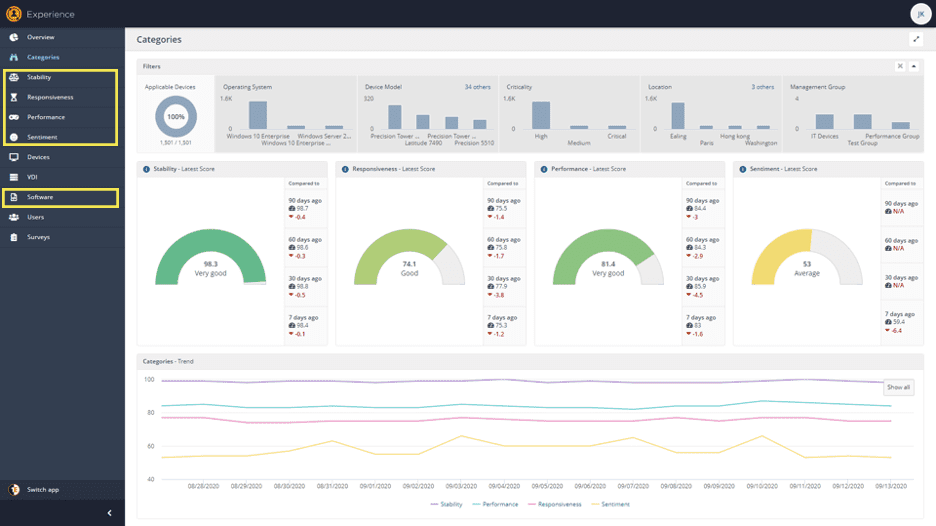
In Software, there is a matching data set for each category, therein lies some of the most useful, actionable data for each Category.
What is Performance?
In today’s blog, we’re looking in detail at “Performance”. You’ll notice that “Performance” comes after “Stability” and “Responsiveness in the menu. This is because we consider it to be the least important set of data. That’s not to say it’s unimportant, but Performance is the measure of device statistics – CPU utilization and process queues, I/O, memory, network, etc.
I know you’re likely wondering how we consider that least important – the reason is that end users don’t care if the CPU queue is getting longer or memory is running out – they care about the impact of those things. If the CPU performance is great, but the machine keeps crashing (Stability), that doesn’t make for a good experience. If the CPU performance is bad, but the button reacts similarly to how it always does, or apps open at the usual speed (we monitor these things with “Responsiveness”), the user is unlikely to notice or care.
Responsiveness, the focus of part 3, tells us when processes take longer than usual to start – Performance helps us understand WHY. It is least important to the user but is very important to IT professionals.
Using Performance data to manage your endpoint estate
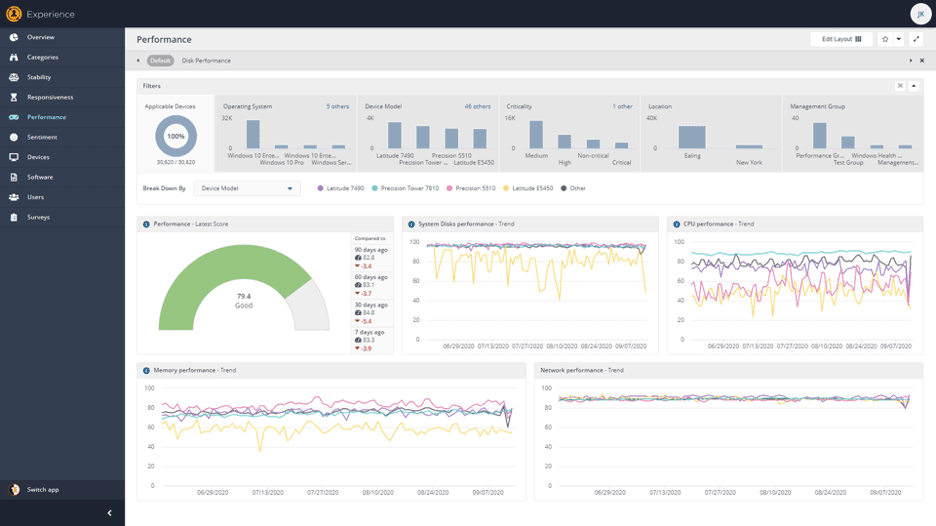
In the screen above, I have chosen to break down Performance scores by device type – this can also be broken down by management group, OS type, location, etc. I can see that, generally speaking, the Latitude E5450’s in this data set perform poorer than any other common device type in disk, CPU and memory performance statistics.
This can be useful information when considering what type of devices to purchase – or when cross-examining this model data with, perhaps, management group information. If I had management groups aligned to job functions, I could see if any users with this device type need to run resource-intensive software (like AutoCAD or SQL Server or similar). If so, it may be a good idea to get these users some different, more powerful devices.
Likewise, I can see that Precision Tower 7810 models have the best CPU performance. If I have users who do NOT need that level of performance, perhaps I can swap some devices around to “right size” the environment and match function to capability.
How to use Performance data to identify problem processes
Another excellent resource for Performance data is on the “Software” screen.
You can use this to identify the software that has the highest impact on device performance. Start by clicking the icon to the right of the “Last 90 days” dropdown.
This allows you to choose additional metrics to show, including several performance-related stats.
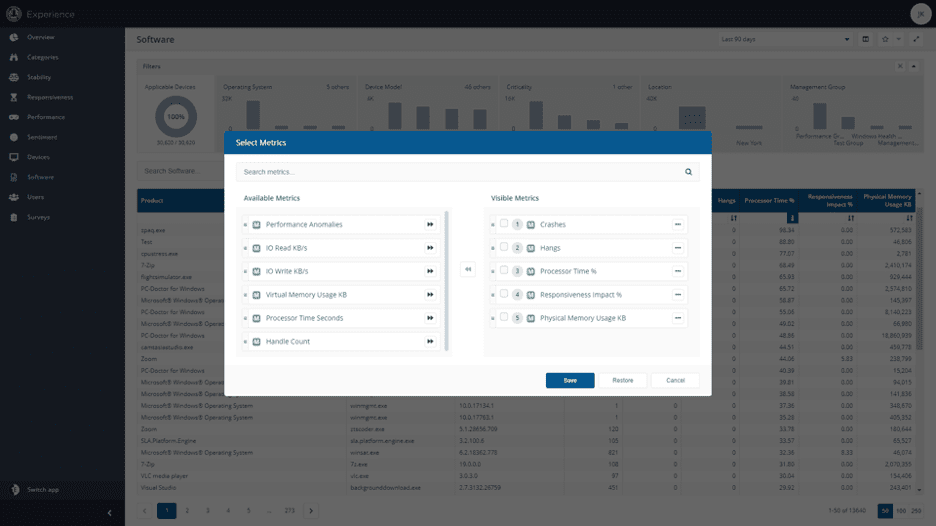
You can then sort by “Processor Time Seconds” or “Virtual Memory Usage” to identify apps which are consuming a lot of resources.
You can also look at this data on a device-by-device basis. Some devices will have poor performance—to check, go to the Device page and sort the devices by Performance score, ascending.
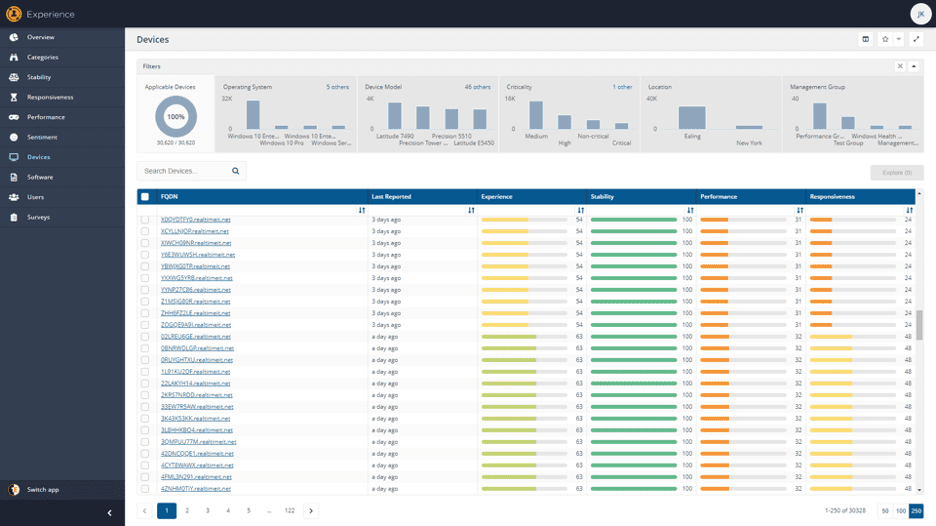
The ones with the poorest score have the largest performance issues. Click on one to get the device details:
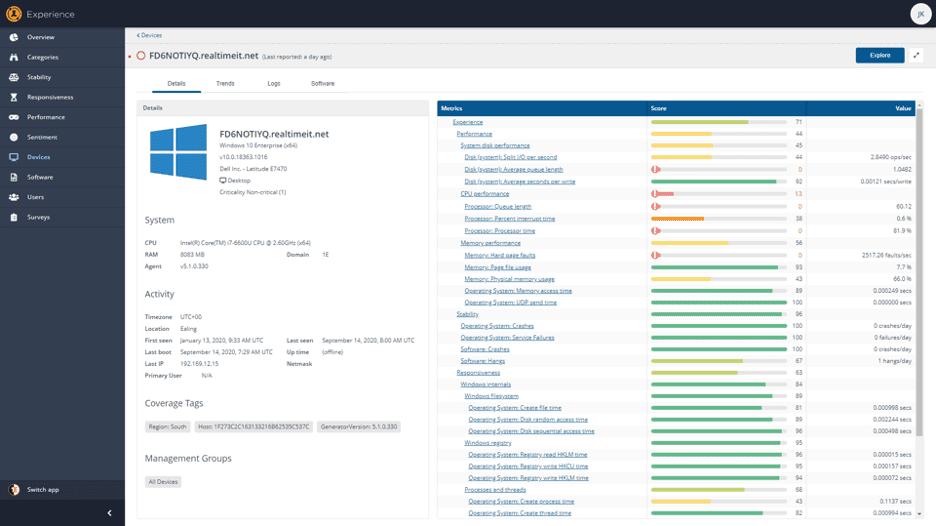
From here you can see the specifics of which performance stats are poor on this device. This particular device has a lot of hard page faults, which is likely exacerbating the CPU and disk issues.
For devices that are online, you can then “Explore” these to dig in further; for example, to identify which processes are causing the number of page faults. Identify the processes that are causing the most page faults and then use Tachyon Explorer to look across all endpoints to identify how many page faults different versions of the process are causing on other machines.
If you identify a problematic version of a process – you can recommend a change across many devices (to move to the best version of the process) and proactively, positively impact the performance of all devices with that software installed.
So, hopefully these examples show you some of the ways in which Experience data can provide insight into actions which can be taken to improve device Performance and to identify devices with Performance issues.
Next week we’ll be showing this in a vlog and the week after, join us as we take a look at Responsiveness data in Tachyon Experience.


