
Understanding the end-user experience has always been important. However, the true benefit is not just in “Digital Experience Monitoring” – but rather in leveraging the data from that to better manage devices. The goal must be to identify issues on a small number of devices as they happen so that you can mitigate against those problems occurring on a large number of devices.
DEM+
Our Tachyon Experience module goes beyond Digital Experience Monitoring to also include Management and Remediation. That’s why we like to call it “DEM+”.
To have the monitoring capability without the associated “plus” is to have knowledge without the ability to act. That’s possibly even worse than action without knowledge. As with most things in life, it is when you marry good data (knowledge) with the ability to act appropriately that you get the best results.
The four parts of this series are as follows:
- Identifying Stability issues in a WFA environment
- Identifying Performance issues in a WFA environment
- Identifying Responsiveness issues in a WFA environment
- Gauging end-user sentiment in a WFA environment
When first using Experience, you can be somewhat dazzled by the pretty graphs and the ability to extract useful data (and from there to perform useful actions) can be less than obvious, but rest assured, there’s lots of depth to the data and valuable insight to be gained.
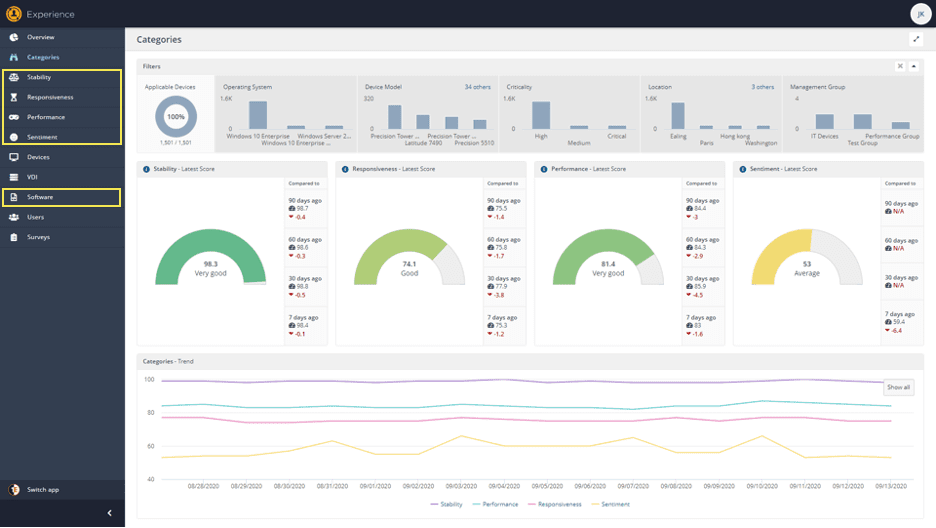
In the menu, beneath each category of Stability, Responsiveness, Performance and Sentiment, you can see “Software”
In Software there is a matching data set for each category, therein lies some of the most useful, actionable data for each Category.
What is Responsiveness?
In today’s blog, we’re looking in detail at “Responsiveness”. You’ll notice that “Responsiveness” comes after “Stability” and before “Performance” in the menu. This is because we consider it to be more important than Performance. Stability is obviously supreme—it doesn’t matter how responsive your device is, if it keeps crashing, that’s a bad user experience.
You may be wondering what the difference is between “Responsiveness” and “Performance”. There are many DEM tools that can tell you about Performance statistics about the CPU, memory, disk, network, etc. However, an end user doesn’t care if the CPU queue is getting longer or memory is running out; they care about the impact of those things on the responsiveness of their machine. If the CPU performance is great, but the machine keeps crashing (Stability), that’s not a good day. If the CPU performance is bad, but the button reacts similarly to how it always does, or apps open at the usual speed (we monitor these things with “Responsiveness”), the user is unlikely to notice or care.
Responsiveness leverages synthetic micro-transactions that execute periodically on the endpoint. Rather than measuring CPU percentage utilization (an example Performance metric), it measures the amount of time taken to create a process. “Responsiveness” metrics are things that end users do during the course of using their machines and things that they’ll likely notice if they slow down a lot.
Leveraging Responsiveness data for better decision making
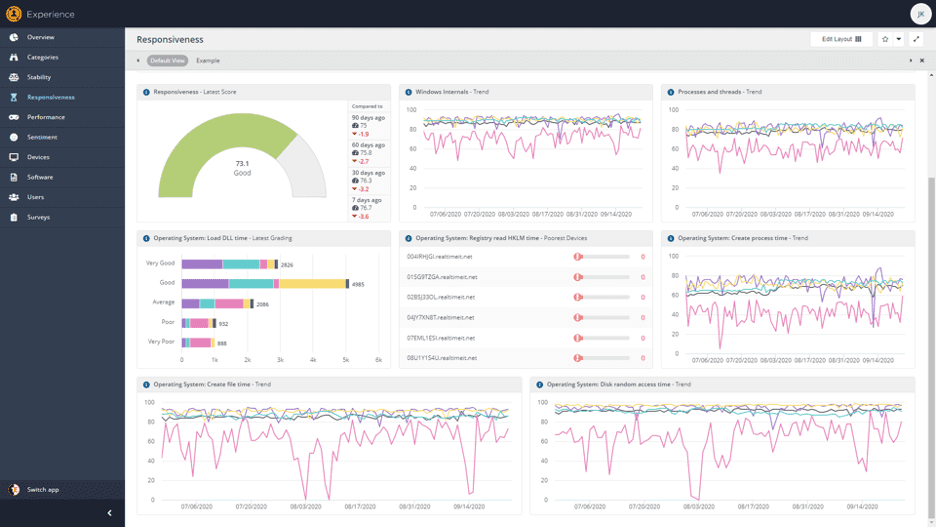
In the screen above, I am looking at 8 different Responsiveness metrics simultaneously. I’ve chosen to break it down by device type, and I can see one type of device (it’s the Dell Latitude E5450) is poorer across almost every metric than any of the other models I have. I have over 2,600 of those devices in this data set—almost 9% of my machines—so understanding where they are slower, and why, is very important.
This can be useful information when considering what type of devices to purchase or identifying what hardware to upgrade to that impact these stats.
Looking at Latitude 7490’s, they perform better across the board. The important question is, “Why?”.
At first, my assumption was that the 7490’s had SSD’s where the 5450’s were slower hard disks, but checking using Tachyon Explorer, I could see this wasn’t the case, the 5450’s had at least as many devices with SSD’s:
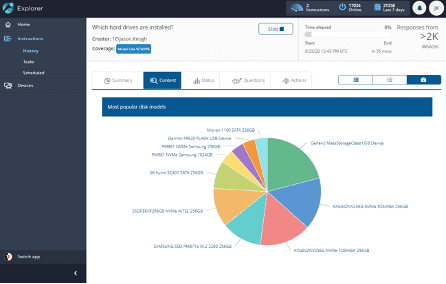 HDD breakdown for 7490’s |
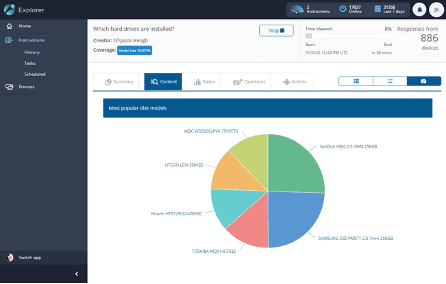 HDD breakdown for 5450’s |
Then I looked at RAM, I could see that the 7490’s had 16Gb to the 5450’s 8Gb. That led me to think that I could improve the performance of the 5450’s by investing in more RAM, rather than buying new devices. I could also see from Explorer questions that the 5450’s were configured with 2x 4Gb DIMM’s, so I’d have to consider than when making decisions about an upgrade.
This type of practical data (from “Tachyon Explorer”), married to meaningful statistics from synthetic micro-transactions (in “Responsiveness”) is unique to Tachyon.
Responsiveness Impact
In the “Software” page, you can see data relating to every process that has been executed. While our synthetic micro-transactions run, we monitor for processes that are having an impact on those transactions. We call this measure the “Responsiveness Impact”.
If we sort the data in “Software” by “Responsiveness Impact” descending, we can see what processes have the largest impact on normal operations of a device:
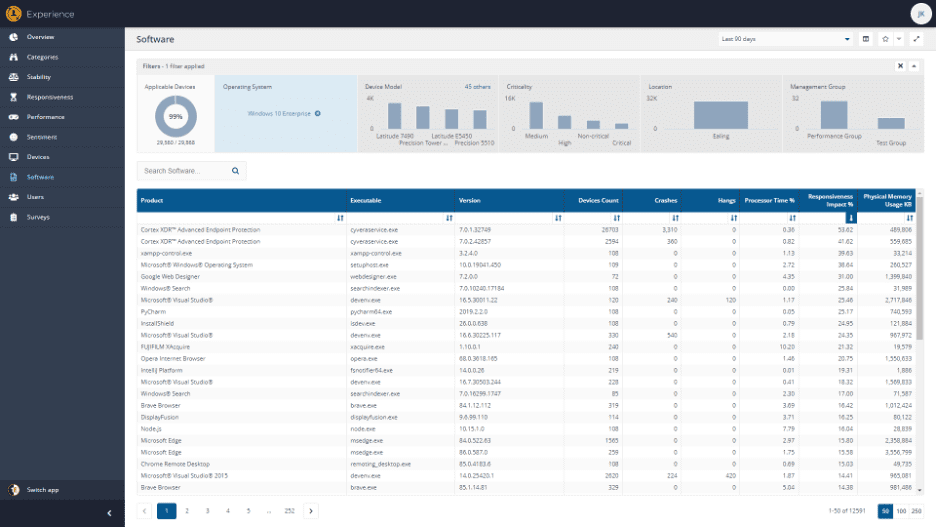
Unsurprisingly, endpoint security tools tend to have the largest negative impact on responsiveness.
These products often don’t have a big impact on “Performance” statistics. They can have low CPU resource utilization on average and small memory usage. They can impact Responsiveness though, particularly if they become active when a process starts and cause a slowdown as a result. This will show as “Responsiveness Impact”.
While it’s useful to be able to identify the worst offenders in general to Responsiveness, it is perhaps more practical when looking at individual products.
For example, if we take the “cyveraservice.exe” process from the list above and use filters to focus on it, we can see that the newer version (7.0.2.x) has a significantly lower “Responsiveness Impact” than the older 7.0.1 version:
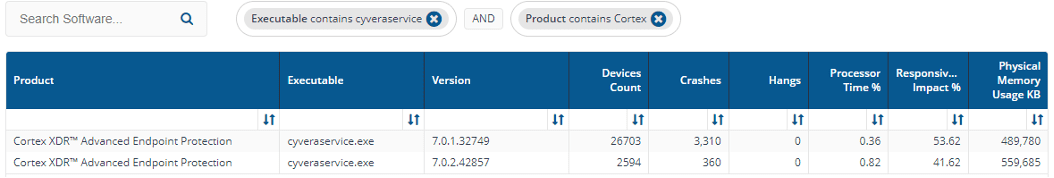
We can also see (harking back to “Stability”) that the newer version crashes about as often as the previous one, and from a “Performance” perspective, both have high RAM usage, but low Processor impact on average.
It is often useful in the real world to identify which versions of given security tooling is most and least impactful on the endpoint responsiveness (rather than just performance stats).
Responsiveness in action
Hopefully, these examples show you some of the ways in which Experience data can provide insight into how to identify and respond to issues with device Responsiveness.
Next week I’ll be recording a vlog on this topic to show Responsiveness in action and the week after, join us as we take a look at the brand new “Sentiment” function in Tachyon Experience. Sentiment uses end-user surveys to gather opinions, which can be compared to the statistical data of “Stability”, “Responsiveness” and “Performance” we’ve looked at to date.


