


Understanding the end-user experience has always been important. However, the true benefit is not just in “Digital Experience Monitoring”, but rather in leveraging the data from that to better manage devices. The goal must be to identify issues on a small number of devices as they happen so that you can mitigate against those problems occurring on a large number of devices.
“Experience” goes beyond Digital Experience Monitoring to also include Management and Remediation. That’s why we also like to call it “DEM+”.
To have the monitoring capability without the associated “plus” is to have knowledge without the ability to act. That’s possibly even worse than action without knowledge. As with most things in life, it is when you marry good data (knowledge) with the ability to act appropriately that you get the best results.
The four parts of this series are as follows:
When first using Experience, you can be somewhat dazzled by the pretty graphs, and the ability to extract useful data (and from there to perform useful actions) can be sub-obvious.
In the menu, beneath each category of Stability, Responsiveness and Performance (to be joined by Sentiment in v5.1 in September 2020) you can see “Software”.
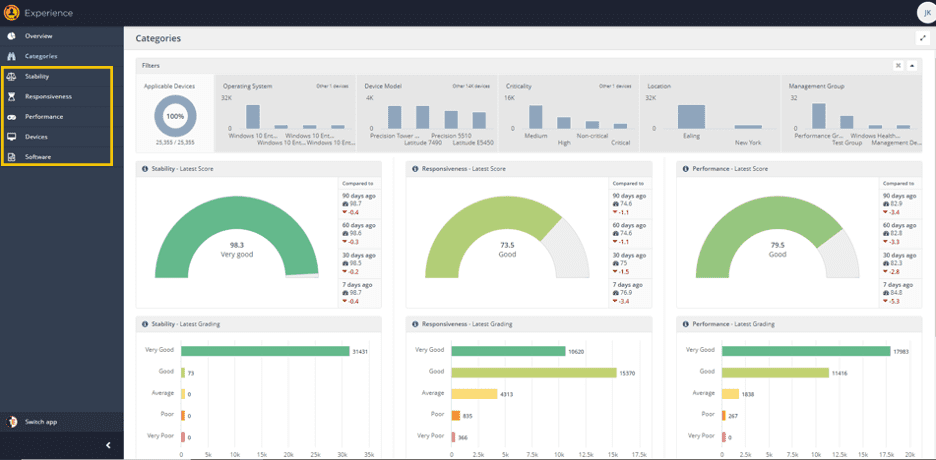
In Software, there is a matching data set for each category, within which lies some of the most useful, actionable data for each category.
In today’s blog, we’re looking in detail at “Stability”. Stability is the measure of “crashiness” to find out how often applications or the OS itself crash or hang.
Stability has the greatest impact on the overall “Experience Score” for a device. If a device is performing well and is responsive to the user, but is crashing and hanging often, the user isn’t going to be pleased with the device. Stability is the very foundation of user experience.
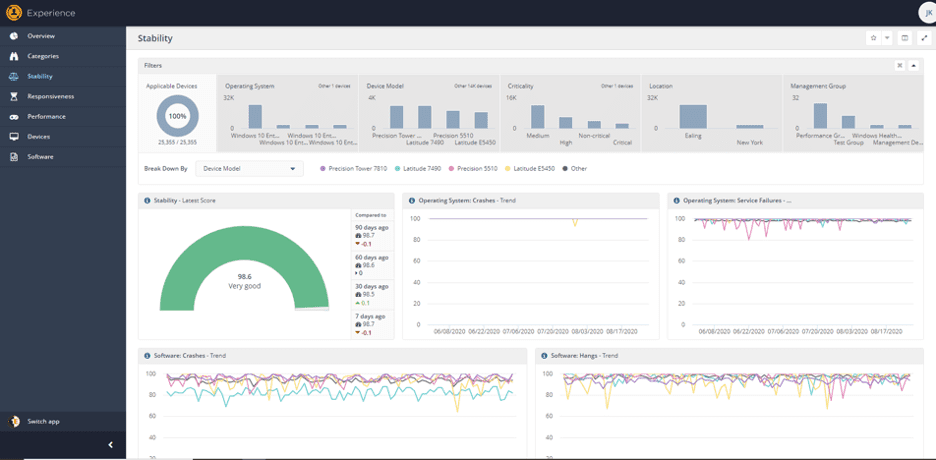
In the screen above, I have chosen to break down Stability scores by device type, but it can also be broken down by management group, OS type, location, etc. I can see that, generally speaking, the Latitude 7490’s in this data set have more software crashes than any other type of device – they are the blue line at the bottom of the “Software Crashes – Trend” graph in the lower left hand side of the screen.
Clicking on the line drills in, and I can see that there are over 3,000 of these devices, making up 12% of my estate:
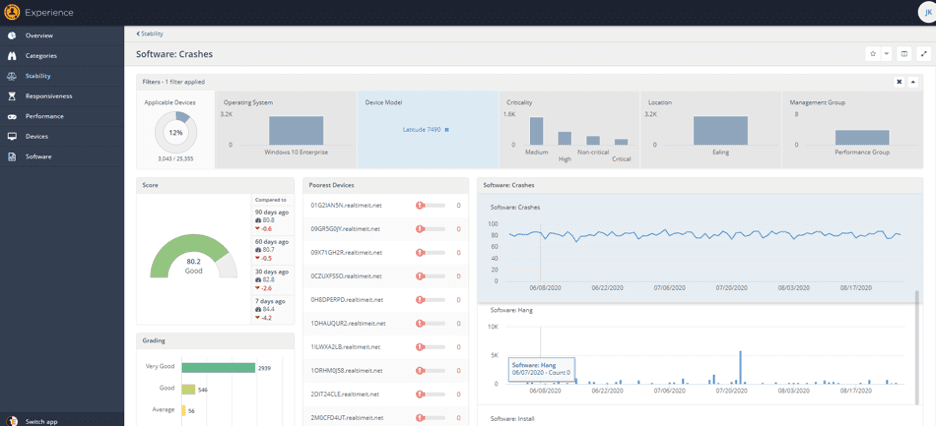
I can scroll through the graphs on the right hand side to see if there’s any correlation between software installations, patches or other significant events and an increase in “crashiness” – which will show as a decrease in Stability and Software Crash scores.
In Experience, a score of 100 is always good, and 0 is always bad – so more crashes decrease the score.
These graphs are useful for getting a sense of overall improvement or otherwise of Stability (or Responsiveness or Performance if you’re in those areas) – but their practical use is really for identifying outliers when looking at types of machines, operating systems, locations, or whatever filter you care to apply.
A less obvious, but (in my opinion) more useful set of stability data is available in the “Software” screen.
You can use this to identify the software that crashes or hangs most frequently, simply by sorting by crashes “descending”. Always of note is not just the number of crashes, but the number of devices where the software is installed.
If you choose to focus on a specific process, in this case where the process name contains “outlook.exe”, you can compare the “crashiness” of different versions. In the example below we can see that, based on data for the past 30 days, the specific build 16.0.13029.20308 of outlook is likely the best to have in the environment…
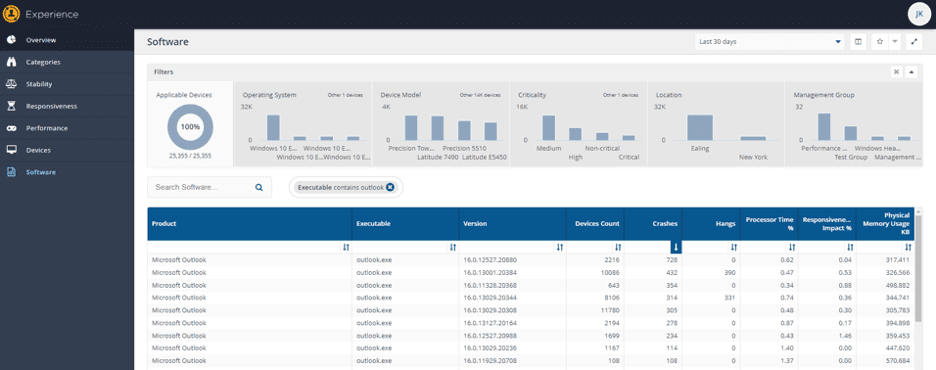
“Why?” I hear you ask.
We can see that it’s installed on 11,780 of the 25k machines in this data set, but it has only crashed 305 times, a crash occurrence rate of 0.025. Version 16.0.12527.20880, however, is installed on 2,216 devices and has crashed 728 times, a crash occurrence rate of 0.32. In other words, the 16.0.12527.20880 build is 13 times more likely to crash than the 16.0.13029.20308 build.
The newest version, 16.0.13127.20164, has crashed 354 times on 643 machines, a rate of 0.55, the worst of the three we’ve looked at so far. So – for my money, I’d standardize the entire environment on 16.0.13029.20308.
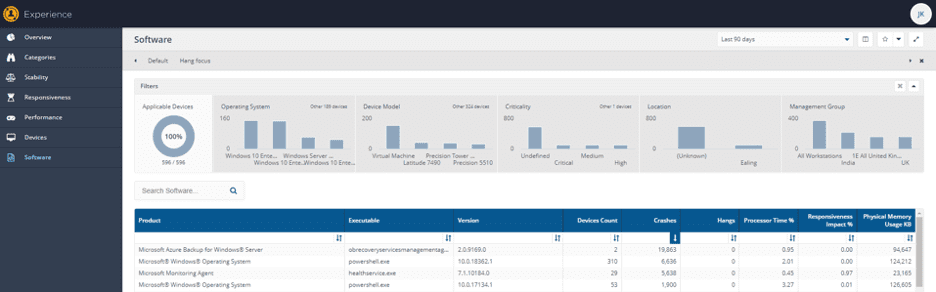
Hopefully, you can see how this data allows you to make more intelligent decisions about versions of software. It can also help you identify potentially problematic versions of a product or problematic products. Take this example from a real-life customer: By sorting all software by crashes, descending, we can see that obrecoveryservicesmanagementagent.exe is crashing a LOT – but only on two machines:
If we search the entire software list for obrecoveryservicesmanagementagent.exe we can see that it is installed on 14 machines, and only 2 are crashing frequently:
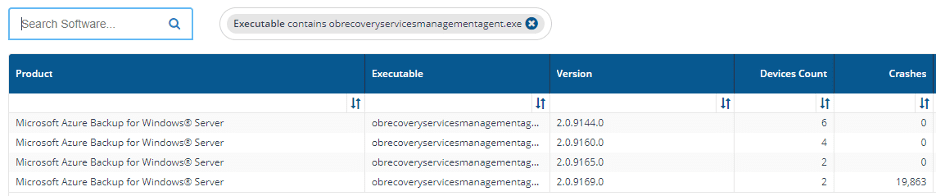
This is a strong indication that version 2.09169.0 isn’t a good choice. 2.0.9165.0 is the newest version without crashes, and all 14 should likely be standardized on that version.
So – hopefully these examples show you some of the ways in which Experience data can provide insight into actions which can be taken to improve device stability.
Next week we’ll be showing this as a vlog and the week after, join us as we take a look at Performance data in Tachyon Experience.


